When it comes to investing in stocks, understanding a company’s true worth is crucial. Simply looking at stock prices is not enough; it is essential to understand why those prices fluctuate. Fundamental analysis plays a key role in this process, helping investors determine whether a stock is worth buying, holding, or selling.
Fundamental analysis is a method used to evaluate a company's financial health and long-term potential. Instead of focusing on short-term price movements, this approach examines key business factors, such as:
Investors use fundamental analysis to estimate a company’s intrinsic value (its true worth) and compare it to its market price. If a stock’s market price is lower than its intrinsic value, it may be undervalued and a good investment opportunity. If the price is much higher, it could be overvalued and risky.
Unlike technical analysis, which focuses on price charts and patterns, fundamental analysis provides a deeper understanding of a company’s actual business strength. It helps long-term investors make informed decisions based on real-world financial and operational factors rather than market speculation.
By mastering fundamental analysis, investors can build a strong and well-balanced portfolio that stands the test of time.
At its core, fundamental analysis revolves around examining a company's financial statements. These statements provide crucial insights into a company's financial health and help investors make informed decisions. The three key financial documents investors analyze are:
The balance sheet provides a snapshot of a company’s financial position at a given point in time. It consists of three major components:
A financially strong company typically has more assets than liabilities, indicating stability and growth potential.
The income statement (also called the profit and loss statement) shows a company’s financial performance over a period of time. Key metrics include:
Consistent revenue growth and increasing net profit are strong indicators of a company's financial health.
The cash flow statement tracks the movement of cash in and out of the company. It is divided into three sections:
A positive cash flow means the company has enough liquidity to cover expenses and invest in growth.
Analyzing financial statements helps investors determine whether a company is financially stable, profitable, and efficiently managing its resources. A strong balance sheet with solid revenue growth, low debt, and a steady stream of cash flow is usually a positive sign.
By understanding these financial indicators, investors can identify high-quality stocks with strong fundamentals and avoid companies with weak financial health.
But numbers alone don’t tell the whole story. A company’s financial health may look good on paper, but without strong leadership, long-term success can be uncertain. This is why evaluating management quality is a crucial part of fundamental analysis. Investors need to assess how well the leadership team is running the business and whether their decisions are driving sustainable growth.
Since leadership quality isn’t directly reflected in financial statements, investors use several methods to assess a company’s management:
A well-managed company is more likely to navigate economic downturns and industry challenges successfully. Even during tough times, strong leadership can keep the company stable, innovate new solutions, and maintain investor confidence.
By analyzing management quality alongside financial performance, investors can make more informed decisions and invest in companies that have the potential to grow and thrive over the long term.
Another crucial factor in fundamental analysis is a company’s market position and competitive advantage. Simply put, investors want to know how well a company stands out from its competitors. A business that holds a strong position in its industry is more likely to maintain stable revenue, grow consistently, and withstand economic downturns.
Not all companies are created equal. Some have unique strengths that allow them to dominate their industry and keep competitors at bay. These key advantages include:
In investing, the term "economic moat" refers to a company’s ability to maintain a competitive advantage over time. Just like a medieval castle protected by a moat, a business with a strong moat is shielded from competitors.
Investors seek companies with a durable competitive advantage because these businesses tend to generate consistent profits, maintain pricing power, and experience long-term growth.
By identifying companies with strong market positions and economic moats, investors can make smarter decisions and focus on stocks with higher potential for sustainable success.
By evaluating a company's financial performance, leadership effectiveness, and competitive position, investors can estimate its intrinsic value—essentially, what the company is truly worth. Intrinsic value is determined by analyzing a company's financial statements, future growth potential, and overall market position.
Once investors estimate a company's intrinsic value, the next step is to compare it with its current market price. This comparison helps in identifying potential investment opportunities:
Unlike short-term trading, which relies on price fluctuations and market speculation, fundamental analysis is a long-term investment strategy. It helps investors make well-informed decisions based on a company's real business potential rather than being influenced by daily market volatility.
By mastering fundamental analysis, investors can create a well-balanced portfolio that withstands market fluctuations. The key is to focus on companies with strong financial health, effective leadership, and a lasting competitive edge.
Ultimately, successful investing is about patience and research. By identifying high-quality businesses and holding them for the long run, investors can build lasting wealth and financial security.

जब स्टॉक्स में निवेश करने की बात आती है, तो किसी कंपनी के वास्तविक मूल्य को समझना बेहद महत्वपूर्ण होता है। केवल स्टॉक की कीमतें देखना पर्याप्त नहीं है; यह समझना आवश्यक है कि वे कीमतें क्यों बदलती हैं। मूलभूत विश्लेषण इस प्रक्रिया में एक महत्वपूर्ण भूमिका निभाता है, जिससे निवेशकों को यह तय करने में मदद मिलती है कि किसी स्टॉक को खरीदना, रखना या बेचना सही होगा या नहीं।
मूलभूत विश्लेषण एक ऐसी विधि है जिसका उपयोग किसी कंपनी की वित्तीय स्थिति और दीर्घकालिक क्षमता का मूल्यांकन करने के लिए किया जाता है। यह अल्पकालिक मूल्य परिवर्तनों पर ध्यान देने के बजाय, प्रमुख व्यावसायिक कारकों का अध्ययन करता है, जैसे:
निवेशक मूलभूत विश्लेषण का उपयोग करके किसी कंपनी के आंतरिक मूल्य (उसकी वास्तविक कीमत) का अनुमान लगाते हैं और इसे उसके बाजार मूल्य से तुलना करते हैं। यदि किसी स्टॉक का बाजार मूल्य उसके आंतरिक मूल्य से कम है, तो यह अल्पमूल्यांकित हो सकता है और एक अच्छा निवेश अवसर साबित हो सकता है। यदि इसका मूल्य बहुत अधिक है, तो यह अधिमूल्यांकित और जोखिमभरा हो सकता है।
तकनीकी विश्लेषण के विपरीत, जो मूल्य चार्ट और पैटर्न पर ध्यान केंद्रित करता है, मूलभूत विश्लेषण किसी कंपनी की वास्तविक व्यावसायिक ताकत को गहराई से समझने में मदद करता है। यह दीर्घकालिक निवेशकों को वास्तविक वित्तीय और परिचालन कारकों के आधार पर सूचित निर्णय लेने में सहायता करता है, न कि केवल बाजार की अटकलों पर।
मूलभूत विश्लेषण में महारत हासिल करके, निवेशक एक मजबूत और संतुलित पोर्टफोलियो बना सकते हैं जो समय की कसौटी पर खरा उतरे।
मूलभूत विश्लेषण के केंद्र में किसी कंपनी के वित्तीय विवरण का गहन विश्लेषण शामिल होता है। ये वित्तीय दस्तावेज निवेशकों को कंपनी की मौजूदा आर्थिक स्थिति और उसकी दीर्घकालिक संभावनाओं को समझने में मदद करते हैं। इनमें तीन प्रमुख रिपोर्टें शामिल हैं:
इन वित्तीय दस्तावेजों का मूल्यांकन करके निवेशक यह तय कर सकते हैं कि कोई कंपनी लाभदायक है या अधिक ऋणग्रस्त और जोखिमपूर्ण स्थिति में है। आमतौर पर, ऐसी कंपनियां जिनका:
निवेशक इन दस्तावेजों की मदद से यह तय कर सकते हैं कि कोई कंपनी दीर्घकालिक निवेश के लिए उपयुक्त है या नहीं। एक मजबूत बैलेंस शीट, स्वस्थ आय विवरण, और सकारात्मक नकदी प्रवाह संकेत देता है कि कंपनी वित्तीय रूप से स्थिर है और भविष्य में भी अच्छा प्रदर्शन कर सकती है।
इसलिए, किसी कंपनी में निवेश करने से पहले उसके वित्तीय दस्तावेजों को समझना और विश्लेषण करना एक आवश्यक कदम होता है।
किसी भी कंपनी की सफलता केवल उसके वित्तीय आंकड़ों पर निर्भर नहीं करती, बल्कि प्रबंधन की गुणवत्ता भी इसमें महत्वपूर्ण भूमिका निभाती है। एक सक्षम नेतृत्व न केवल कंपनी को सही दिशा में ले जाता है, बल्कि आर्थिक मंदी और उद्योग की चुनौतियों से भी कंपनी को सफलतापूर्वक उबार सकता है।
प्रबंधन की कार्यशैली और निर्णय लेने की क्षमता यह तय करती है कि कोई कंपनी दीर्घकालिक रूप से टिकाऊ और लाभदायक रहेगी या नहीं। निवेशकों को निम्नलिखित पहलुओं पर ध्यान देना चाहिए:
एक मजबूत और अनुभवी नेतृत्व वाली कंपनियां आमतौर पर कठिन समय में भी अच्छा प्रदर्शन करती हैं। जब निवेशक किसी कंपनी में पैसा लगाते हैं, तो उन्हें यह देखना चाहिए कि:
अंततः, अच्छा प्रबंधन ही किसी कंपनी के भविष्य का निर्धारण करता है। यदि नेतृत्व मजबूत, कुशल और पारदर्शी है, तो कंपनी को दीर्घकालिक निवेश के लिए एक बेहतर विकल्प माना जा सकता है।
जब निवेश की बात आती है, तो केवल वित्तीय प्रदर्शन ही नहीं, बल्कि कंपनी की बाजार में स्थिति और प्रतिस्पर्धात्मक लाभ भी महत्वपूर्ण भूमिका निभाते हैं। एक कंपनी का उद्योग में स्थान और प्रतिस्पर्धियों के मुकाबले उसकी ताकत यह तय कर सकती है कि वह दीर्घकालिक रूप से कितनी सफल होगी।
प्रतिस्पर्धात्मक लाभ का अर्थ है कि कोई कंपनी अपनी अनूठी विशेषताओं के कारण बाजार में अन्य कंपनियों की तुलना में बेहतर प्रदर्शन कर सकती है। यह लाभ निम्नलिखित कारणों से मिल सकता है:
निवेश की दुनिया में "खाई" (Moat) शब्द उस प्रतिस्पर्धात्मक बढ़त को दर्शाता है जो किसी कंपनी को लंबे समय तक सुरक्षित रखती है। यह एक ऐसा कारक होता है जो किसी व्यवसाय को दूसरों से अलग करता है और उसके बाजार में बने रहने की संभावना को बढ़ाता है।
जो कंपनियां दीर्घकालिक रूप से अच्छा प्रदर्शन करती हैं, उनमें कुछ सामान्य विशेषताएँ होती हैं:
किसी कंपनी की बाजार स्थिति और प्रतिस्पर्धात्मक बढ़त का विश्लेषण करने से निवेशक यह तय कर सकते हैं कि वह कंपनी दीर्घकालिक रूप से सफल होगी या नहीं। यदि कोई कंपनी अपने प्रतिस्पर्धियों से आगे निकलने में सक्षम है और बाजार में अपनी स्थिरता बनाए रख सकती है, तो वह निवेश के लिए एक मजबूत विकल्प हो सकती है।
इसलिए, निवेश से पहले यह देखना जरूरी है कि कंपनी का प्रतिस्पर्धात्मक लाभ कितना मजबूत है और क्या वह भविष्य में भी बनाए रखा जा सकता है।
एक सफल निवेशक बनने के लिए यह समझना जरूरी है कि किसी कंपनी की वास्तविक कीमत क्या होनी चाहिए। इसका निर्धारण करने के लिए निवेशक विभिन्न कारकों जैसे वित्तीय प्रदर्शन, नेतृत्व की प्रभावशीलता और प्रतिस्पर्धात्मक स्थिति का मूल्यांकन करते हैं। इन सभी पहलुओं के आधार पर, वे किसी कंपनी के आंतरिक मूल्य (Intrinsic Value) का अनुमान लगाते हैं।
आंतरिक मूल्य किसी कंपनी की वह अनुमानित कीमत होती है, जो उसकी वास्तविक वित्तीय स्थिति और भविष्य की संभावनाओं पर आधारित होती है। यह मूल्य किसी स्टॉक के मौजूदा बाजार मूल्य से अलग हो सकता है, क्योंकि बाजार में कीमतें भावनाओं, अफवाहों और अल्पकालिक कारकों से प्रभावित होती हैं।
कई तरीके हैं जिनसे निवेशक किसी कंपनी के आंतरिक मूल्य का निर्धारण कर सकते हैं:
एक निवेशक का लक्ष्य यह देखना होता है कि आंतरिक मूल्य वर्तमान बाजार मूल्य से कैसे मेल खाता है:
आंतरिक मूल्य का सही आकलन करना निवेशकों को सूचित निर्णय लेने में मदद करता है। इससे वे यह तय कर सकते हैं कि किसी स्टॉक में निवेश करना चाहिए या नहीं।
अंततः, बाजार की हलचल और शॉर्ट-टर्म उतार-चढ़ाव से बचते हुए, निवेशकों को कंपनियों के वास्तविक आंतरिक मूल्य को समझने और उसके अनुसार निवेश करने की जरूरत होती है। इससे वे एक मजबूत और स्थायी निवेश पोर्टफोलियो बना सकते हैं।
निवेश की दुनिया में सफल होने के लिए केवल बाजार के उतार-चढ़ाव पर ध्यान देना पर्याप्त नहीं है। मूलभूत विश्लेषण एक ऐसी रणनीति है जो दीर्घकालिक दृष्टिकोण अपनाने पर जोर देती है। यह निवेशकों को कंपनी के वास्तविक मूल्य और संभावनाओं के आधार पर सही निर्णय लेने में मदद करता है, बजाय इसके कि वे बाजार की अस्थिरता और अल्पकालिक रुझानों से प्रभावित हों।
यह विश्लेषण निवेशकों को भावनाओं और बाजार की हाइप से बचने में मदद करता है। शॉर्ट-टर्म ट्रेडिंग में अक्सर भावनात्मक निर्णय लिए जाते हैं, जिससे गलत निवेश का जोखिम बढ़ जाता है। इसके विपरीत, मूलभूत विश्लेषण कंपनियों की वित्तीय ताकत, नेतृत्व की गुणवत्ता और उद्योग में उनकी स्थिति पर केंद्रित रहता है।
मूलभूत विश्लेषण में महारत हासिल करके, निवेशक एक मजबूत और संतुलित पोर्टफोलियो बना सकते हैं जो समय की कसौटी पर खरा उतरे। इसके लिए:
अंततः, दीर्घकालिक निवेश रणनीति के तहत सही कंपनियों को चुनकर, धैर्यपूर्वक निवेश बनाए रखकर और बाजार की शॉर्ट-टर्म हलचल से प्रभावित हुए बिना ठोस निर्णय लेकर, निवेशक लंबे समय तक संपत्ति बना सकते हैं और वित्तीय स्वतंत्रता प्राप्त कर सकते हैं। 🎯📊
Technical analysis focuses on analyzing historical price movements and trading volumes to predict future market trends. By using various tools and indicators, traders can identify patterns that help them make informed decisions. Key indicators often include:
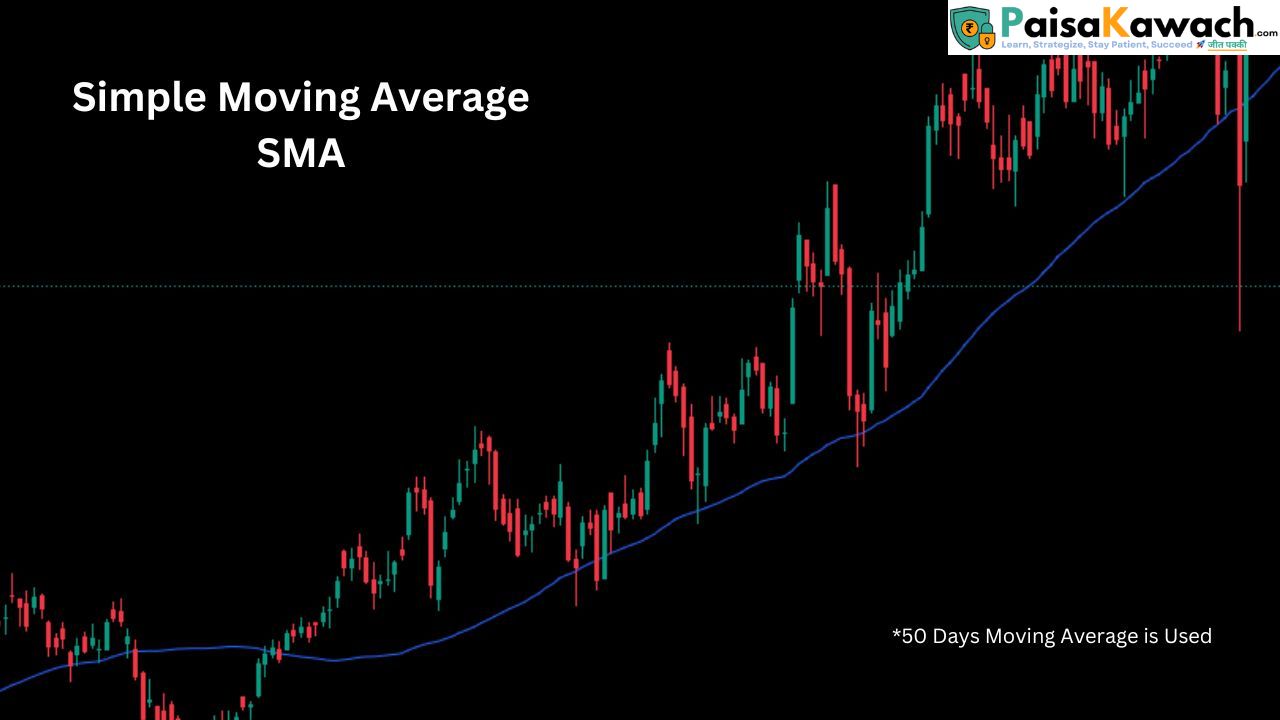
Here, the 50-day moving average is used on the daily chart time frame.
Moving averages are among the most popular and widely used tools in technical analysis. They help smooth out short-term fluctuations in a security's price by averaging the price over a specific period, allowing traders to better identify trends. The two primary types of moving averages are the Simple Moving Average (SMA) and Exponential Moving Average (EMA). Both of these moving averages can give valuable insight into price movements, but they differ in how they react to changes in the market.
The Simple Moving Average (SMA) is the most basic type of moving average, calculated by taking the average of a security's price over a set number of periods. For example, a 50-day SMA is the average of the closing prices of the last 50 days. The formula for SMA is:
SMA = (P1 + P2 + ... + Pn) / n
Where P1, P2, ..., Pn are the price points (typically closing prices) for the number of periods, and n is the number of periods used. The SMA is useful for identifying long-term trends, but it tends to lag behind the current price action, as it treats all data points equally.
The Exponential Moving Average (EMA) differs from the SMA in that it gives more weight to recent prices, making it more sensitive to current price movements. As a result, the EMA reacts faster to price changes, which makes it more suitable for short-term traders. The formula for EMA is more complex than SMA and involves calculating a weighting multiplier based on the period selected. Here's the formula:
EMA = (Closing Price - Previous EMA) * Multiplier + Previous EMA
The Multiplier is calculated as:
Multiplier = 2 / (n + 1)
Where n is the number of periods. The faster response of the EMA makes it a useful tool for identifying short-term trends and potential reversals more quickly than the SMA.
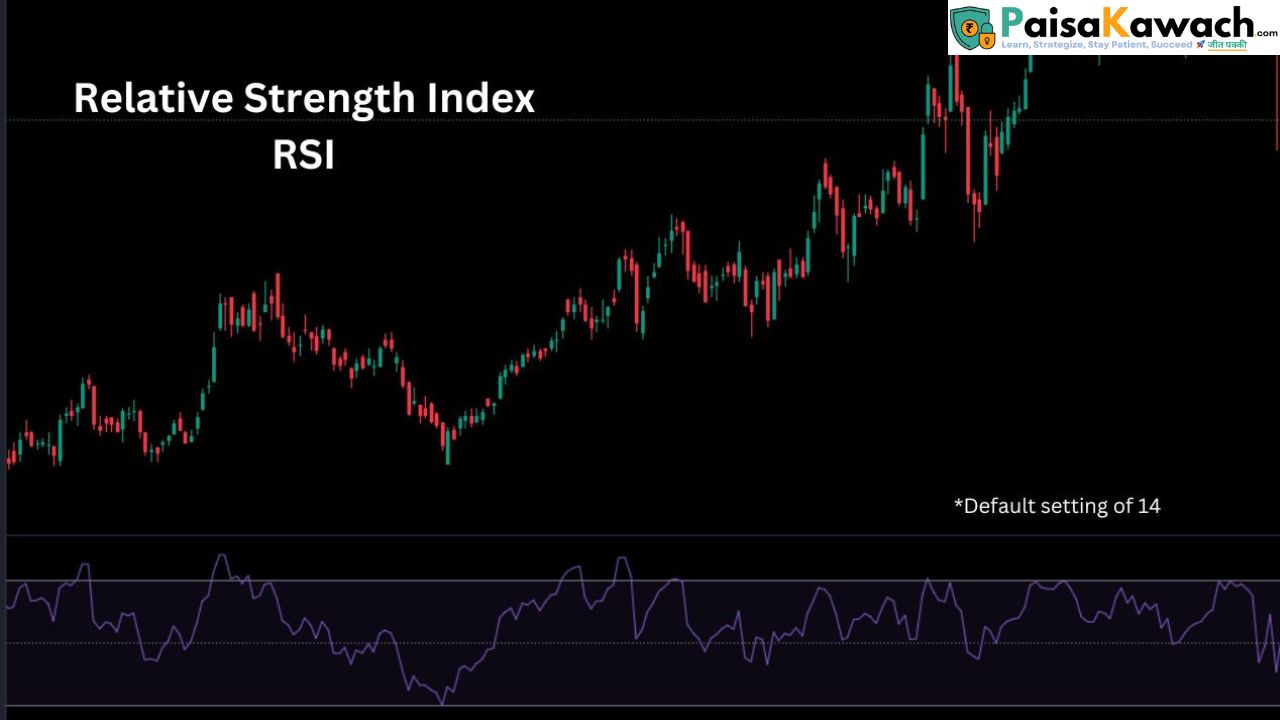
Here the default setting of 14 periods is used for the RSI (Relative Strength Index) indicator.
The Relative Strength Index (RSI) is a momentum oscillator that measures the speed and change of price movements. Developed by J. Welles Wilder, the RSI helps traders identify whether a security is overbought or oversold, signaling potential reversal points. RSI is one of the most commonly used indicators in technical analysis, often used in combination with other tools to confirm trends and market conditions.
The RSI is calculated using a formula that compares the magnitude of recent gains to recent losses over a specific period, typically 14 days. Here's the formula:
RSI = 100 - (100 / (1 + RS))
Where RS is the relative strength, calculated as the average of the up closes divided by the average of the down closes over the specified period (usually 14). The value of the RSI is displayed as a number between 0 and 100.
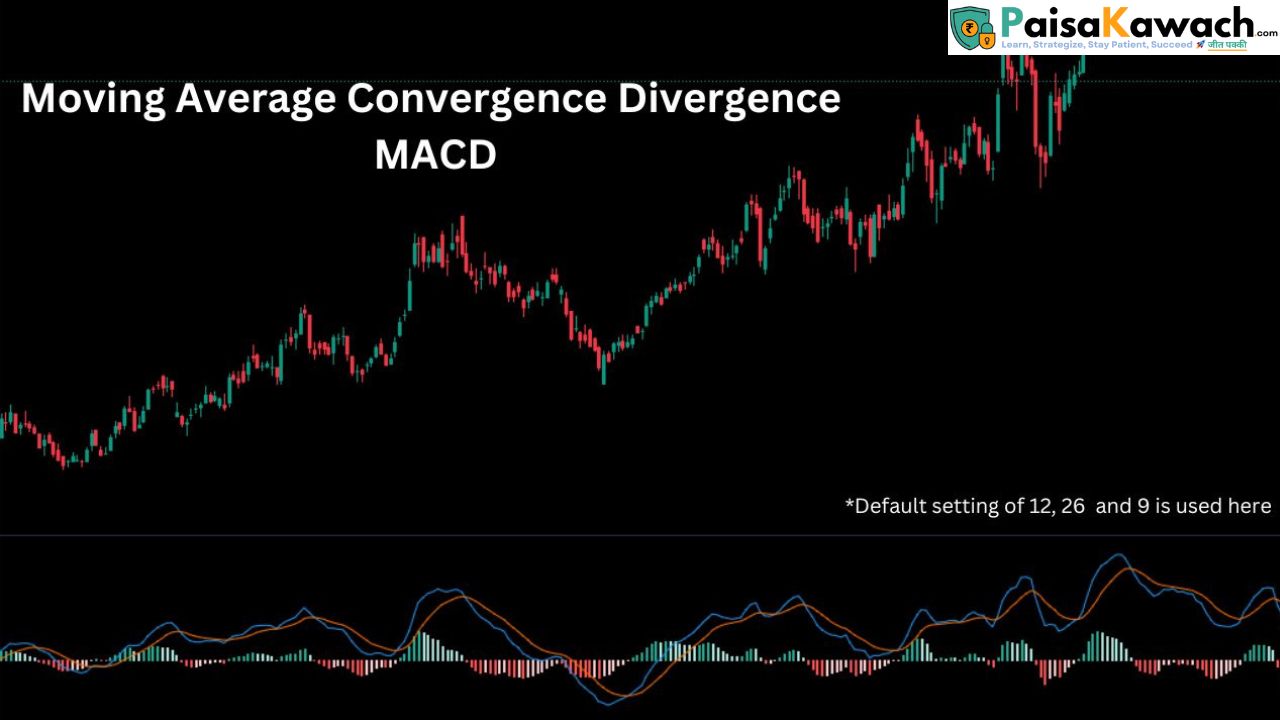
The default setting of 12, 26, and 9 periods is used for the MACD (Moving Average Convergence Divergence) indicator.
The Moving Average Convergence Divergence (MACD) is a trend-following momentum indicator that helps traders identify the direction, duration, and strength of a trend in a market. It was developed by Gerald Appel in the late 1970s and has since become one of the most widely used indicators in technical analysis.
The MACD is calculated by subtracting the 26-period Exponential Moving Average (EMA) from the 12-period EMA. This difference generates the MACD line, which reflects short-term momentum. The result is then compared with the Signal Line, which is typically a 9-period EMA of the MACD line. The formula for MACD calculation is:
    MACD = 12-Period EMA - 26-Period EMA
    Signal Line = 9-Period EMA of MACD
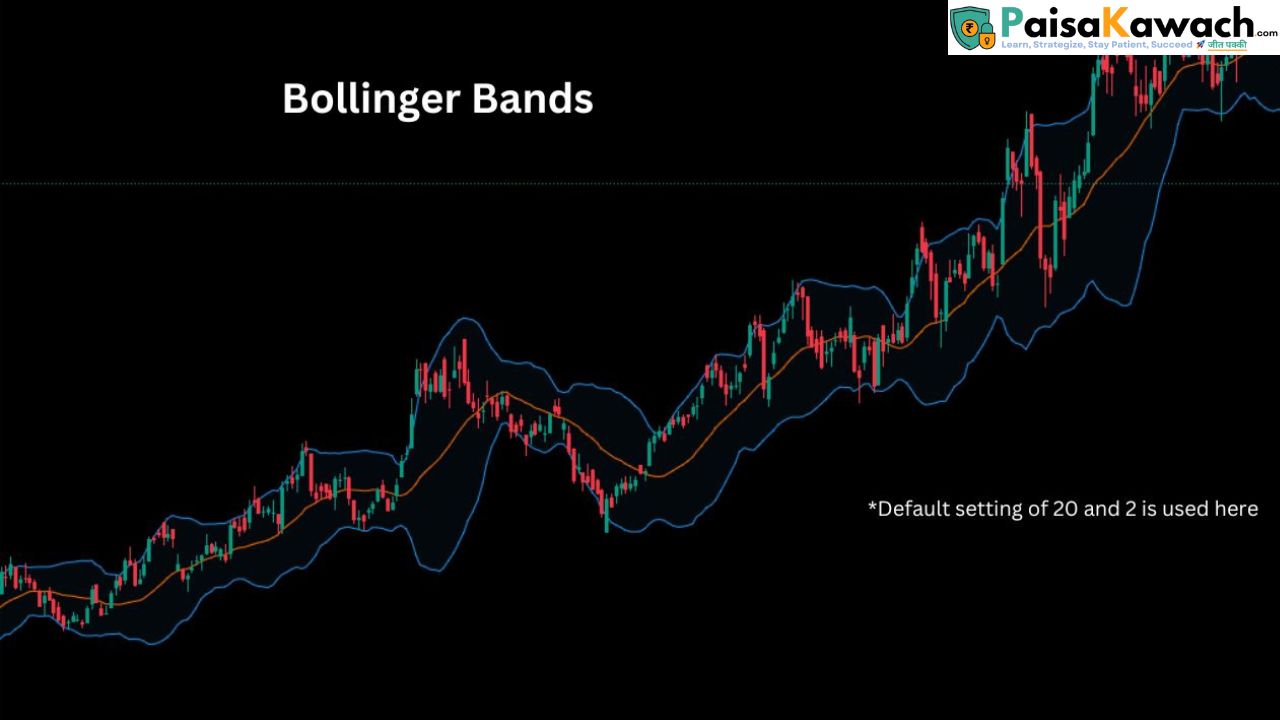
The default setting of a 20-period simple moving average and 2 standard deviations is used for the Bollinger Bands indicator.
Bollinger Bands is a volatility indicator developed by John Bollinger in the 1980s, widely used in technical analysis. It helps traders understand whether an asset is overbought or oversold based on its recent price movement. The indicator consists of three lines: the middle band, the upper band, and the lower band. The bands expand and contract based on market volatility, making it a powerful tool for assessing the current market conditions.
The formula for calculating Bollinger Bands is as follows:
    Upper Band = Middle Band + (2 x Standard Deviation)
    Lower Band = Middle Band - (2 x Standard Deviation)
Where: - The Middle Band is typically the 20-period SMA of the asset's price. - The Standard Deviation measures the volatility of the asset's price. A higher standard deviation results in wider bands, indicating higher volatility.
Chart Patterns are graphical representations of price movements that occur over time on a price chart. They are formed by the price action of a security, and they help traders predict future price movements by identifying recurring patterns. These patterns are based on historical price behavior, and they can indicate potential trend reversals or continuations. Chart patterns are widely used by technical analysts to make informed trading decisions. Below, we will explore some of the most common chart patterns that traders use in their analysis:
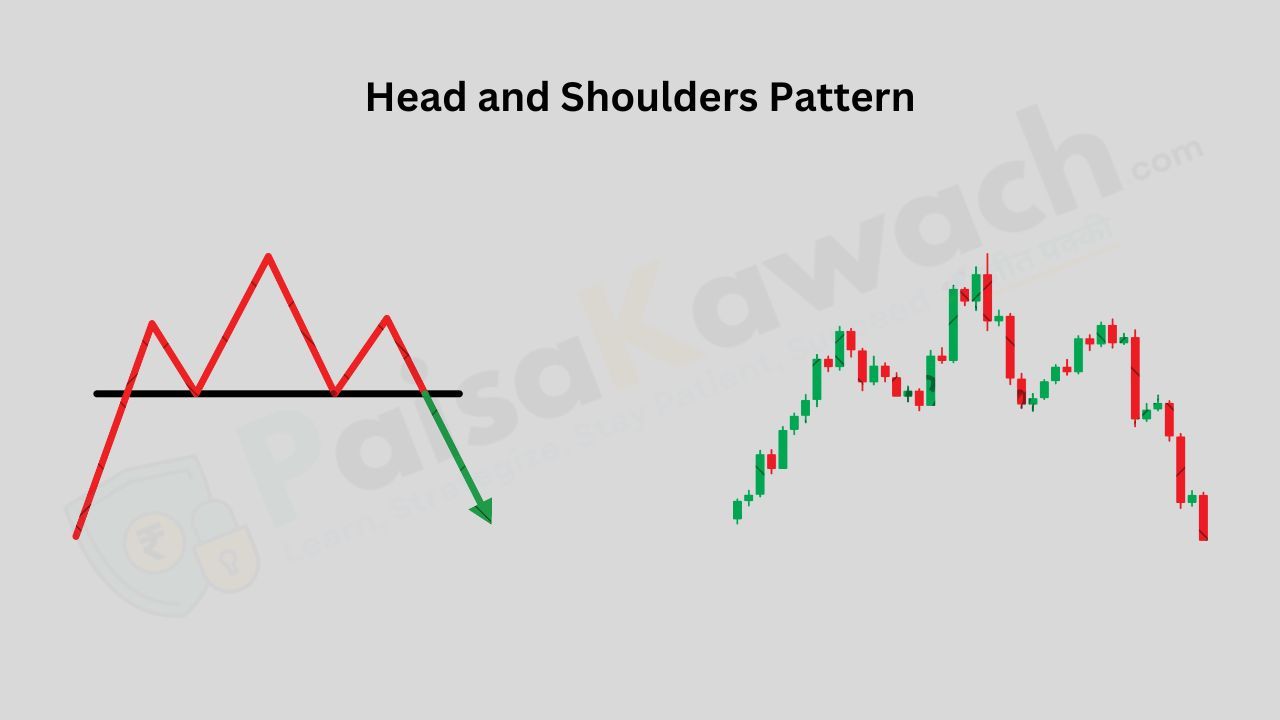
Head and Shoulders: The Head and Shoulders pattern is one of the most reliable trend reversal patterns. It consists of three peaks: a higher peak (head) in the middle and two lower peaks (shoulders) on either side. This pattern suggests that an uptrend is about to reverse into a downtrend once the price breaks below the neckline, a support level drawn connecting the lows of the shoulders.
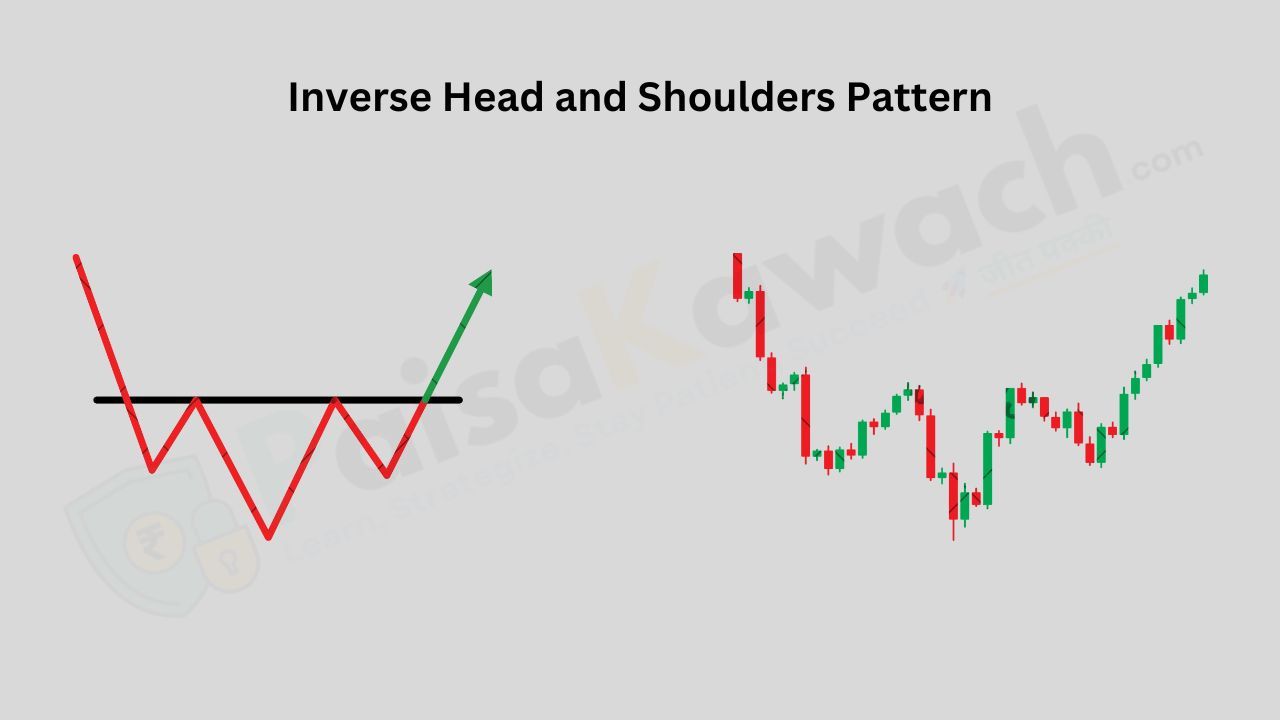
Inverse Head and Shoulders: This is the reverse of the head and shoulders pattern and signals a potential reversal from a downtrend to an uptrend. The price action forms three troughs: the lowest trough (head) in the middle and two higher troughs (shoulders) on either side. A breakout above the neckline indicates a bullish trend reversal.
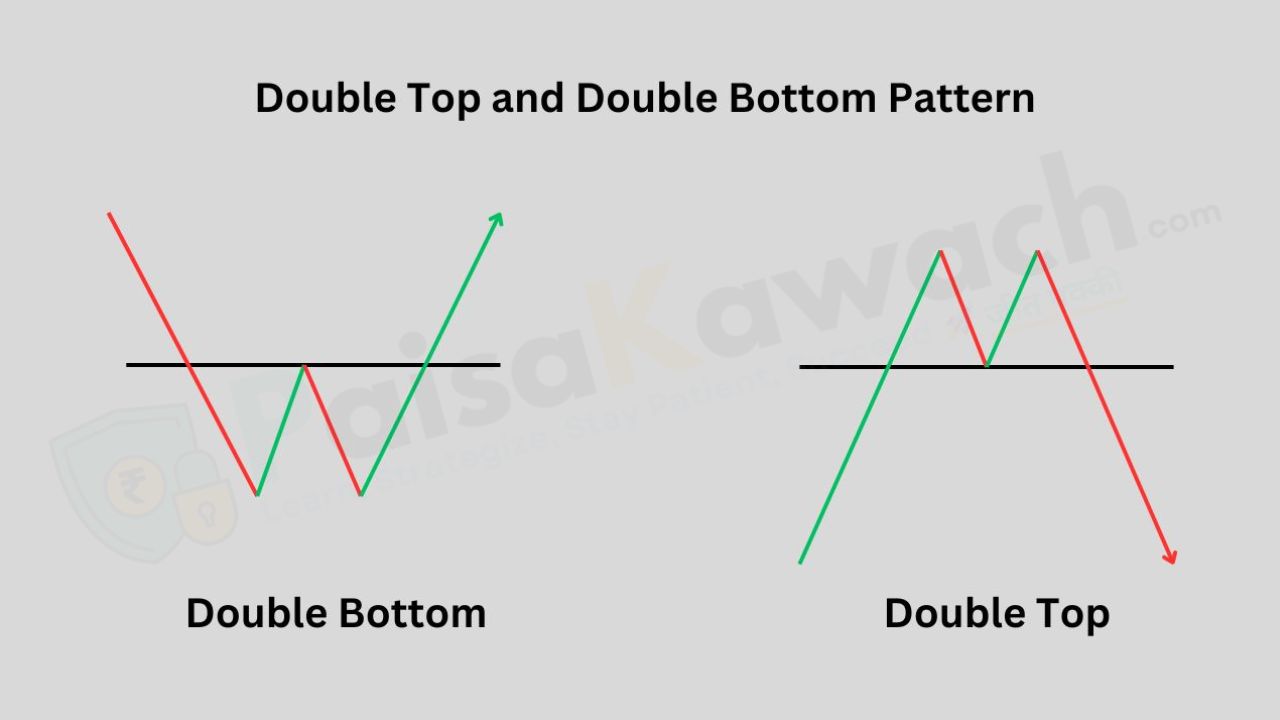
Double Top and Double Bottom: The Double Top is a bearish reversal pattern that occurs after an uptrend. It consists of two peaks at roughly the same level, followed by a decline below the trough in between. The pattern suggests that the price will reverse downward after the second peak. On the other hand, the Double Bottom is a bullish reversal pattern that occurs after a downtrend. It forms two troughs at roughly the same level, followed by a rise above the peak in between, signaling the start of an uptrend.
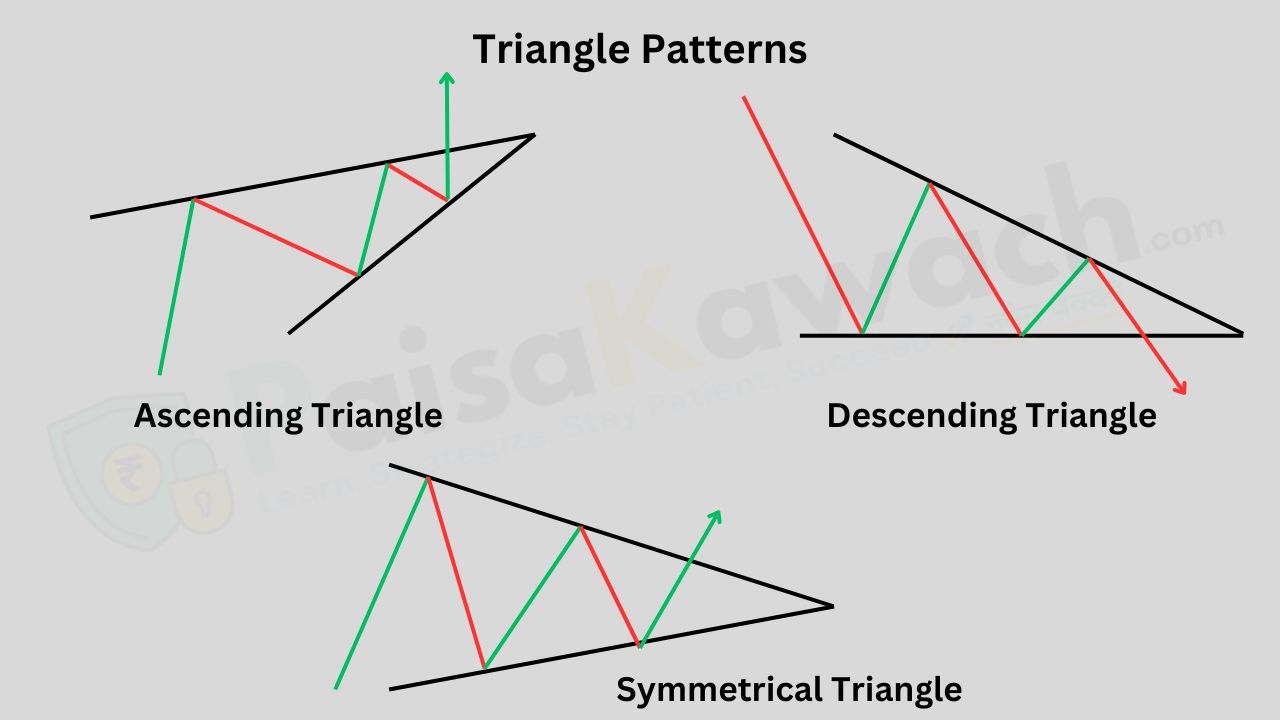
Triangles: Triangles are consolidation patterns that form when the price moves within a narrowing range between two converging trendlines. There are three main types of triangles:
Ascending Triangle: This pattern is characterized by a horizontal resistance line at the top and an upward-sloping support line at the bottom. The breakout occurs when the price moves above the resistance level, signaling a bullish trend.
Descending Triangle: The descending triangle features a horizontal support line at the bottom and a downward-sloping resistance line at the top. A breakout below the support line indicates a bearish trend.
Symmetrical Triangle: In this pattern, both the support and resistance lines slope towards each other, indicating a period of consolidation before a breakout in either direction. The breakout can be bullish or bearish, depending on the direction of the breakout.
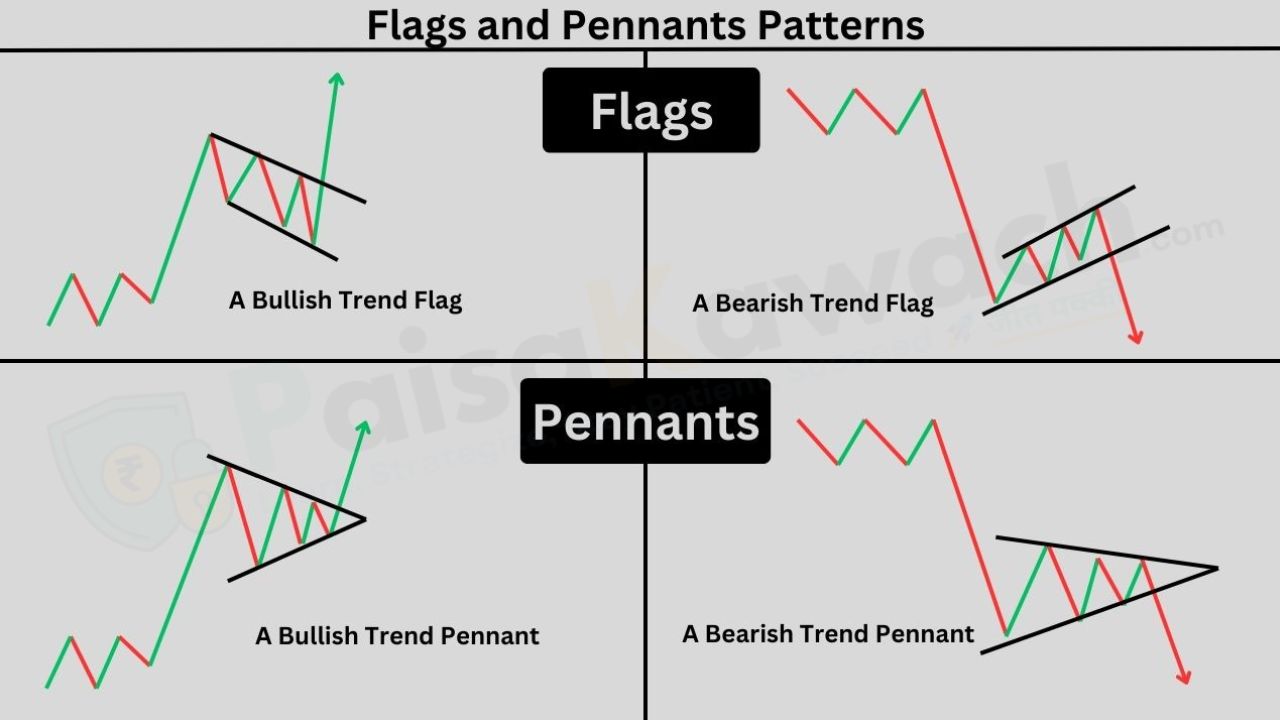
Flags and Pennants: Flags and pennants are short-term continuation patterns that occur after a strong price movement. A Flag forms as a rectangular-shaped consolidation, slanting against the prevailing trend, while a Pennant forms as a small symmetrical triangle. Both patterns signal that the prevailing trend is likely to continue after the breakout.
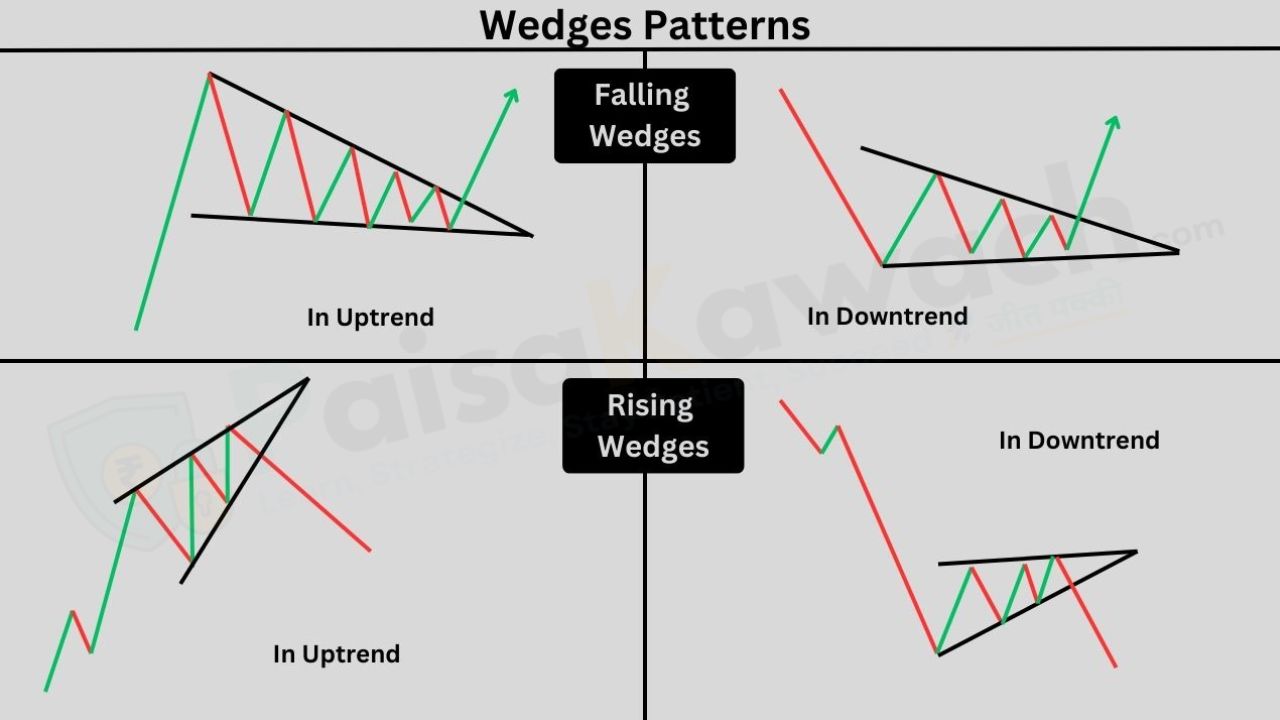
Wedges: A wedge pattern is a type of consolidation pattern that shows a narrowing of price action within converging trendlines. There are two types:
Rising Wedge: This pattern occurs when both the support and resistance lines slope upwards, indicating a potential bearish reversal if the price breaks below the lower trendline.
Falling Wedge: A falling wedge pattern occurs when both the support and resistance lines slope downwards, indicating a potential bullish reversal if the price breaks above the upper trendline.
Traders use chart patterns to predict future price movements and decide when to enter or exit a trade. Here’s how to approach trading with chart patterns:
These tools help traders assess the strength of a trend, identify possible entry and exit points, and manage risk effectively.
By analyzing the combination of these tools and understanding their signals, traders attempt to forecast future price movements. Technical analysis can be applied to all types of markets, including stocks, forex, and cryptocurrencies. However, it is important to note that while technical analysis can improve the odds of successful trades, it is not foolproof. A solid risk management strategy is crucial for long-term success in trading.
Technical analysis has become the go-to strategy for many traders, especially those who specialize in short-term trading, like day traders and swing traders. These traders aim to profit from swift price movements, often within hours or days, and technical analysis provides them with the necessary tools to make informed decisions based on price action alone. Unlike fundamental analysis, which dives into financial reports, earnings, and economic conditions, technical analysis ignores these factors and focuses solely on price data. This makes it highly effective for navigating volatile markets where prices can change rapidly.
For traders who want to make quick decisions, such as day traders or swing traders, technical analysis offers a clear advantage. It allows them to spot trends, reversals, and patterns that provide opportunities for entering and exiting trades within short periods. Here's why it's so valuable for them:
One of the most appealing aspects of technical analysis is its adaptability. Whether you're a scalper trading within minutes or a long-term investor tracking broader market trends, technical analysis can be adjusted to fit any time frame.
Unlike other forms of analysis, which are often swayed by external events like earnings reports, geopolitical tensions, or breaking news, technical analysis remains independent. This is a huge advantage for traders who prefer a more structured and rule-based approach.
All in all, technical analysis is a cornerstone of successful short-term trading. It gives traders the tools to act quickly, adapt to any timeframe, and make data-driven decisions without relying on unpredictable external factors. It’s no wonder that so many traders turn to this approach—it’s simple, flexible, and highly effective in capturing price movements in the market.
This approach is especially popular with traders who seek to capitalize on price movements within shorter time frames. For instance, day traders look for quick price swings throughout the day, while swing traders might hold positions for a few days or weeks to capture bigger trends.

तकनीकी विश्लेषण ऐतिहासिक मूल्य आंदोलनों और व्यापार वॉल्यूम का विश्लेषण करने पर केंद्रित होता है, ताकि भविष्य के बाजार रुझानों का पूर्वानुमान लगाया जा सके। विभिन्न उपकरणों और संकेतकों का उपयोग करके, व्यापारी पैटर्न पहचान सकते हैं जो उन्हें सूचित निर्णय लेने में मदद करते हैं। प्रमुख संकेतकों में निम्नलिखित शामिल हैं:
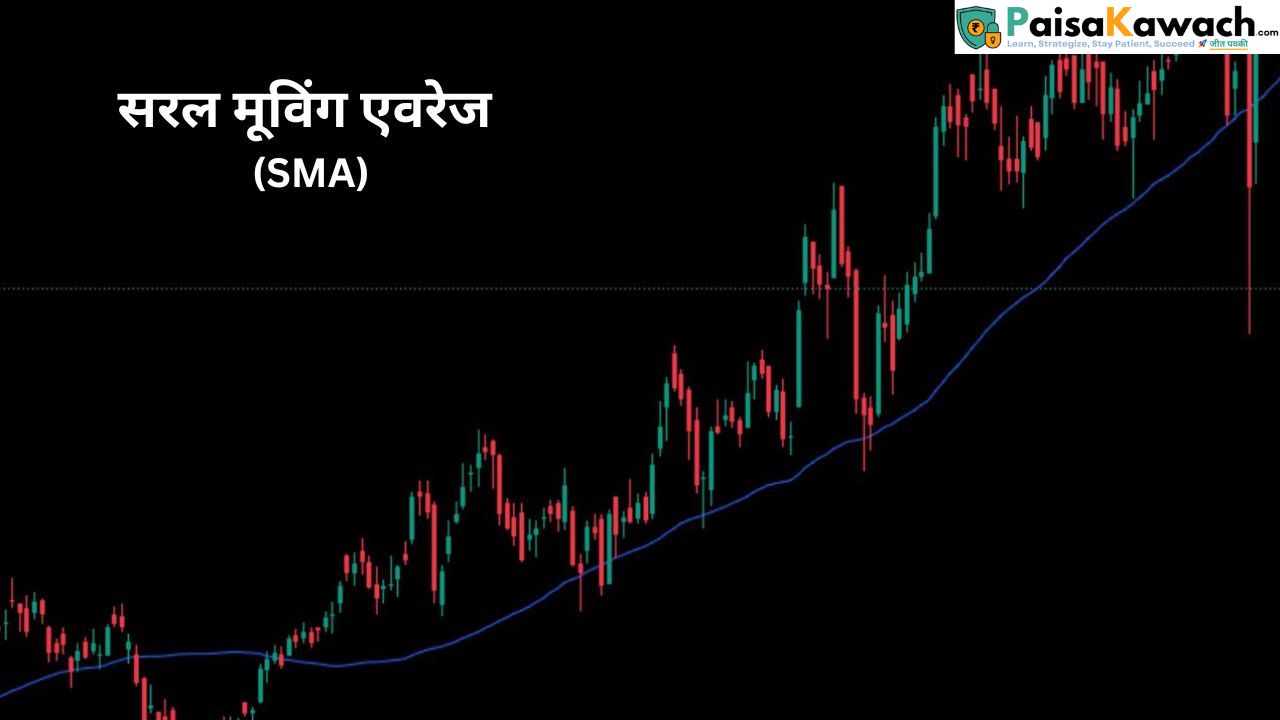
यहाँ, दैनिक चार्ट समय सीमा पर 50-दिन की मूविंग एवरेज का उपयोग किया गया है।
मूविंग एवरेजेस तकनीकी विश्लेषण में सबसे लोकप्रिय और व्यापक रूप से उपयोग किए जाने वाले उपकरणों में से एक हैं। ये किसी सुरक्षा की कीमत में छोटे समयावधि के उतार-चढ़ाव को चिकना करने में मदद करते हैं, और इसे एक विशिष्ट अवधि में औसत करके व्यापारियों को ट्रेंड की बेहतर पहचान करने में मदद मिलती है। मूविंग एवरेजेस के दो मुख्य प्रकार हैं: साधारण मूविंग एवरेज (SMA) और एप्सोनेंशियल मूविंग एवरेज (EMA)। इन दोनों मूविंग एवरेजेस से मूल्य परिवर्तनों पर मूल्यवान जानकारी मिल सकती है, लेकिन वे बाजार में होने वाले परिवर्तनों पर अलग-अलग प्रतिक्रिया करते हैं।
साधारण मूविंग एवरेज (SMA) मूविंग एवरेज का सबसे बुनियादी प्रकार है, जिसे एक सुरक्षा की कीमत का औसत लेकर एक निश्चित अवधि में गणना की जाती है। उदाहरण के लिए, 50-दिन का SMA पिछले 50 दिनों के समापन मूल्यों का औसत होता है। SMA का सूत्र इस प्रकार है:
SMA = (P1 + P2 + ... + Pn) / n
जहाँ P1, P2, ..., Pn मूल्य बिंदु होते हैं (सामान्यत: समापन मूल्य) और n उस अवधि की संख्या होती है जिसका उपयोग किया जाता है। SMA दीर्घकालिक ट्रेंड की पहचान करने के लिए उपयोगी होता है, लेकिन यह वर्तमान मूल्य क्रिया के पीछे हो सकता है, क्योंकि यह सभी डेटा बिंदुओं को समान रूप से मानता है।
एप्सोनेंशियल मूविंग एवरेज (EMA) SMA से अलग है, क्योंकि यह हाल के मूल्यों को अधिक महत्व देता है, जिससे यह वर्तमान मूल्य परिवर्तनों के प्रति अधिक संवेदनशील होता है। इसके परिणामस्वरूप, EMA मूल्य परिवर्तनों पर जल्दी प्रतिक्रिया करता है, जो इसे छोटे समयावधि के व्यापारियों के लिए अधिक उपयुक्त बनाता है। EMA का सूत्र SMA से अधिक जटिल होता है और इसमें चयनित अवधि के आधार पर एक भारांक गुणांक की गणना की जाती है। इसका सूत्र इस प्रकार है:
EMA = (समापन मूल्य - पिछला EMA) * गुणांक + पिछला EMA
गुणांक की गणना इस प्रकार होती है:
गुणांक = 2 / (n + 1)
जहाँ n उस अवधि की संख्या होती है। EMA की तेज़ प्रतिक्रिया इसे छोटे समयावधि के ट्रेंड और संभावित पलटावों की पहचान करने के लिए उपयोगी बनाती है।
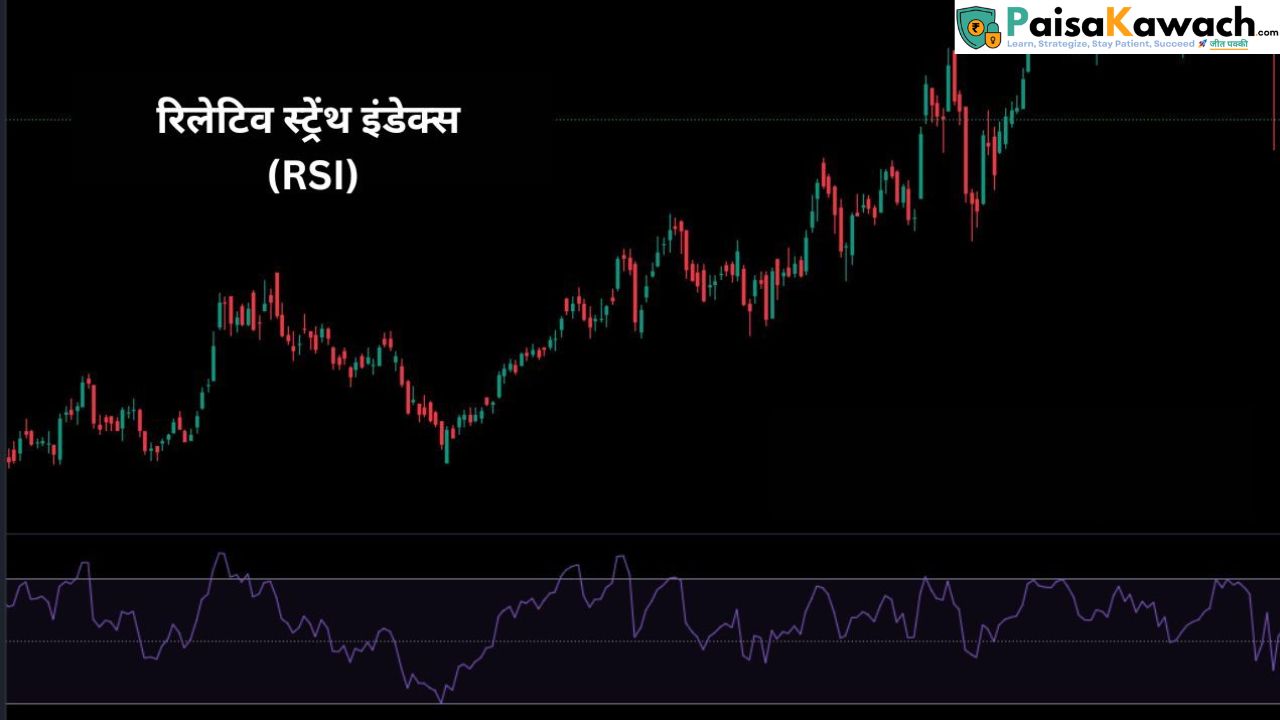
यहाँ RSI (रिलेटिव स्ट्रेंथ इंडेक्स) संकेतक की डिफ़ॉल्ट 14-अवधि सेटिंग का उपयोग किया गया है।
रिलेटिव स्ट्रेंथ इंडेक्स (RSI) एक मोमेंटम ऑस्सीलेटर है जो मूल्य आंदोलनों की गति और परिवर्तन को मापता है। इसे J. Welles Wilder द्वारा विकसित किया गया था, और यह ट्रेडर्स को यह पहचानने में मदद करता है कि कोई सुरक्षा ओवरबॉट (अत्यधिक खरीदी गई) है या ओवरसोल्ड (अत्यधिक बेची गई), जो संभावित रिवर्सल प्वाइंट्स को संकेतित करता है। RSI तकनीकी विश्लेषण में सबसे सामान्य रूप से उपयोग किए जाने वाले संकेतकों में से एक है, और यह अक्सर अन्य उपकरणों के साथ संयोजन में ट्रेंड्स और मार्केट कंडीशंस की पुष्टि करने के लिए उपयोग किया जाता है।
RSI एक फार्मूला का उपयोग करके कैलकुलेट किया जाता है, जो हाल की लाभों की मात्रा को हाल की हानियों से तुलना करता है, आमतौर पर 14 दिनों की अवधि में। यहाँ फार्मूला है:
RSI = 100 - (100 / (1 + RS))
जहाँ RS रिलेटिव स्ट्रेंथ है, जिसे ऊपर बंद होने वाली औसतों को नीचे बंद होने वाली औसतों से विभाजित करके निर्दिष्ट अवधि (आमतौर पर 14) के लिए कैलकुलेट किया जाता है। RSI का मान 0 से 100 के बीच एक संख्या के रूप में प्रदर्शित होता है।
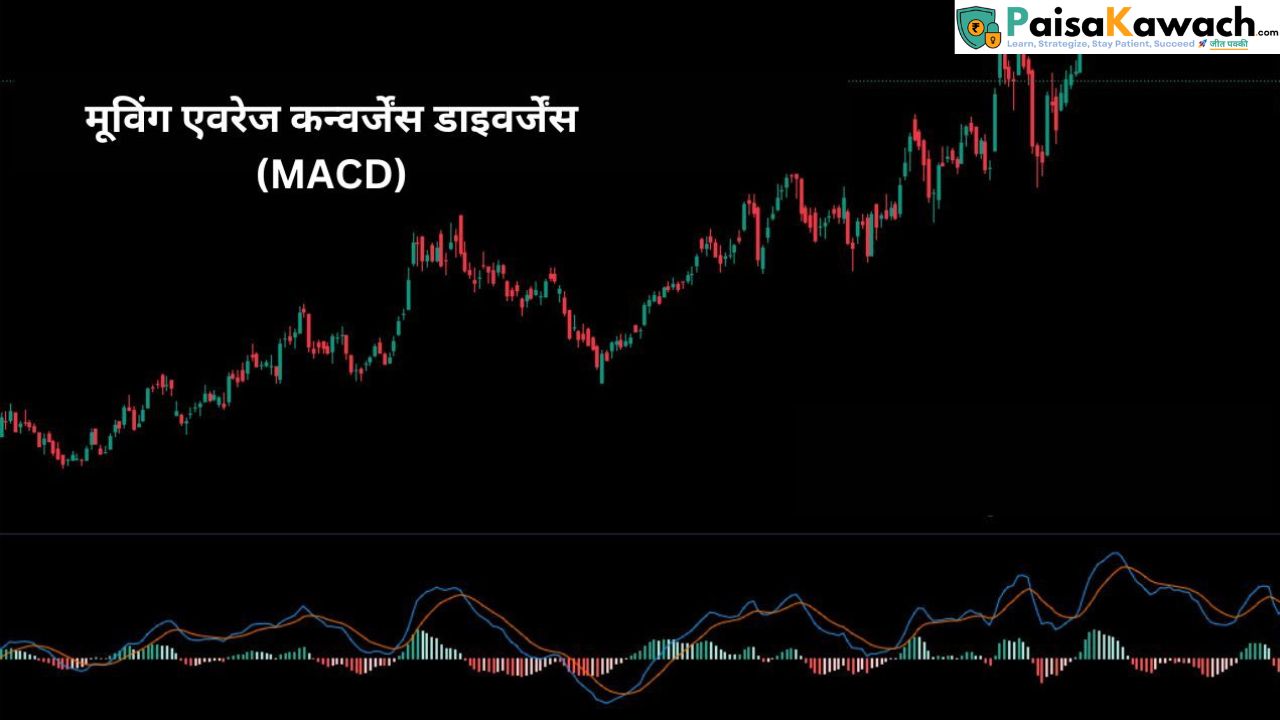
यहाँ MACD (मूविंग एवरेज कन्वर्जेंस डाइवर्जेंस) संकेतक के लिए डिफ़ॉल्ट 12, 26 और 9-अवधि सेटिंग का उपयोग किया गया है।
मूविंग एवरेज कंवर्जेंस डाइवर्जेंस (MACD) एक ट्रेंड-फॉलोइंग मोमेंटम इंडिकेटर है जो ट्रेडर्स को मार्केट में ट्रेंड की दिशा, अवधि और ताकत पहचानने में मदद करता है। इसे 1970 के दशक के अंत में Gerald Appel द्वारा विकसित किया गया था और तब से यह तकनीकी विश्लेषण में सबसे व्यापक रूप से उपयोग किए जाने वाले संकेतकों में से एक बन गया है।
MACD 26-पीरियड एक्सपोनेंशियल मूविंग एवरेज (EMA) को 12-पीरियड EMA से घटाकर कैलकुलेट किया जाता है। इस अंतर से MACD लाइन उत्पन्न होती है, जो शॉर्ट-टर्म मोमेंटम को दर्शाती है। परिणाम को फिर सिग्नल लाइन से तुलना की जाती है, जो आमतौर पर MACD लाइन का 9-पीरियड EMA होता है। MACD कैलकुलेशन का फार्मूला इस प्रकार है:
    MACD = 12-पीरियड EMA - 26-पीरियड EMA
    सिग्नल लाइन = MACD का 9-पीरियड EMA
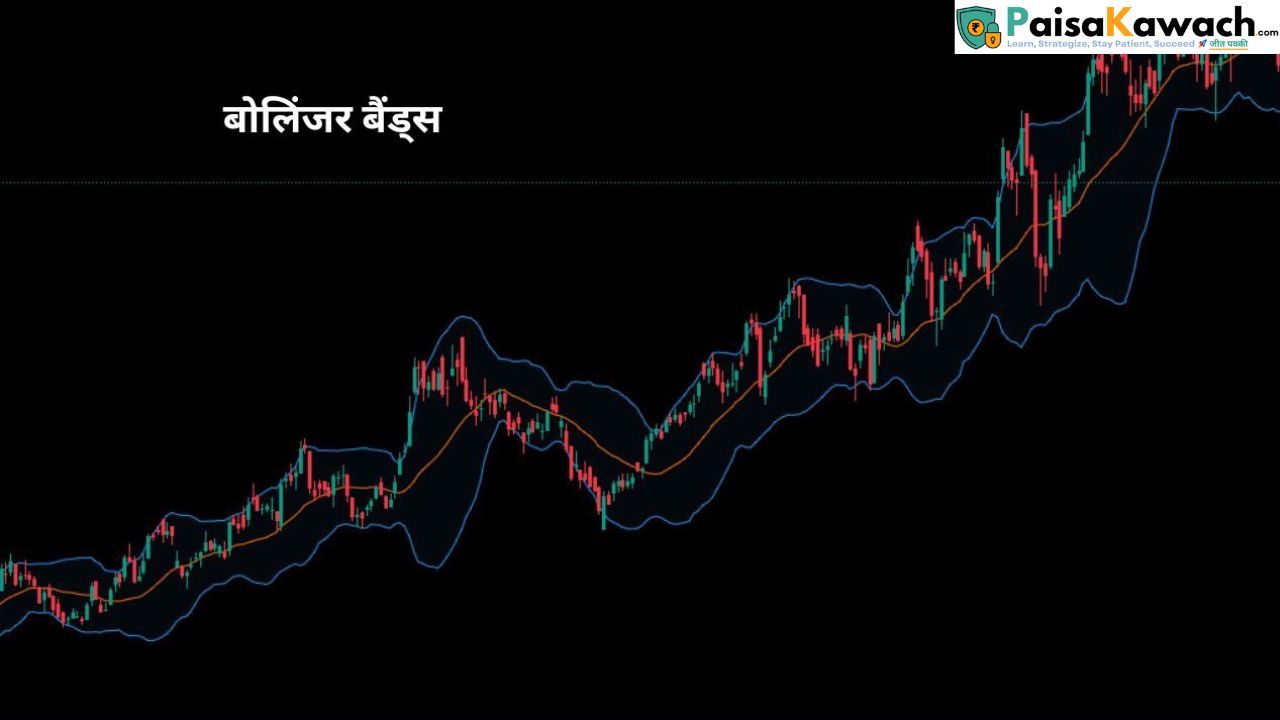
यहाँ बोलिंजर बैंड्स संकेतक के लिए डिफ़ॉल्ट 20-अवधि की सरल मूविंग एवरेज और 2 मानक विचलन का उपयोग किया गया है।
बोलिंजर बैंड्स एक वोलैटिलिटी इंडिकेटर है जिसे 1980 के दशक में जॉन बोलिंजर द्वारा विकसित किया गया था, जो तकनीकी विश्लेषण में व्यापक रूप से उपयोग किया जाता है। यह ट्रेडर्स को यह समझने में मदद करता है कि क्या किसी संपत्ति की हाल की मूल्य गति के आधार पर वह अधिक खरीदी गई है या अधिक बेची गई है। यह इंडिकेटर तीन लाइनों से बना होता है: मिडल बैंड, अपर बैंड, और लोवर बैंड। बैंड्स बाजार की वोलैटिलिटी के आधार पर फैलते और सिकुड़ते हैं, जिससे यह वर्तमान बाजार की स्थिति का आकलन करने के लिए एक शक्तिशाली उपकरण बनता है।
बोलिंजर बैंड्स की गणना का फार्मूला इस प्रकार है:
    अपर बैंड = मिडल बैंड + (2 x मानक विचलन)
    लोवर बैंड = मिडल बैंड - (2 x मानक विचलन)
जहाँ: - मिडल बैंड सामान्यतः संपत्ति की कीमत का 20-पीरियड SMA होता है। - मानक विचलन संपत्ति की कीमत की वोलैटिलिटी को मापता है। अधिक मानक विचलन का मतलब है कि बैंड्स चौड़े होते हैं, जो उच्च वोलैटिलिटी को दर्शाता है।
चार्ट पैटर्न्स मूल्य चालों के ग्राफिकल प्रतिनिधित्व होते हैं जो समय के साथ मूल्य चार्ट पर बनते हैं। ये एक सिक्योरिटी की मूल्य क्रिया द्वारा निर्मित होते हैं और व्यापारियों को पुनरावृत्त पैटर्न की पहचान करके भविष्य की मूल्य चालों का पूर्वानुमान लगाने में मदद करते हैं। ये पैटर्न ऐतिहासिक मूल्य व्यवहार पर आधारित होते हैं और संभावित ट्रेंड रिवर्सल या निरंतरता को दर्शा सकते हैं। चार्ट पैटर्न्स का उपयोग तकनीकी विश्लेषकों द्वारा सूचित व्यापारिक निर्णय लेने के लिए व्यापक रूप से किया जाता है। नीचे, हम कुछ सबसे सामान्य चार्ट पैटर्न्स का अन्वेषण करेंगे जिनका उपयोग व्यापारी अपने विश्लेषण में करते हैं:
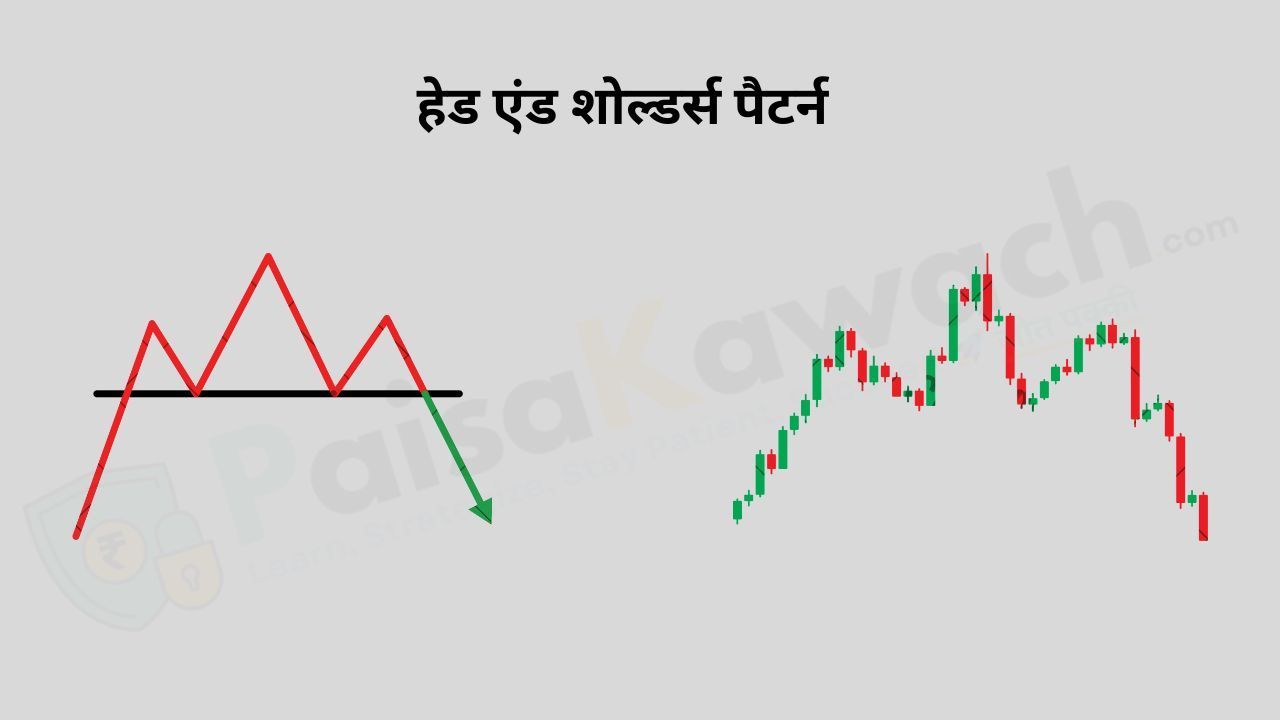
हेड एंड शोल्डर्स: हेड एंड शोल्डर्स पैटर्न सबसे विश्वसनीय ट्रेंड रिवर्सल पैटर्न्स में से एक है। इसमें तीन चोटियाँ होती हैं: बीच में एक उच्च चोटी (हेड) और दोनों ओर दो निम्न चोटियाँ (शोल्डर्स)। यह पैटर्न संकेत देता है कि जब कीमत नेकलाइन (शोल्डर्स की लोवर्स को जोड़ने वाली सपोर्ट लाइन) से नीचे टूटती है, तो अपट्रेंड डाउनट्रेंड में बदल सकता है।
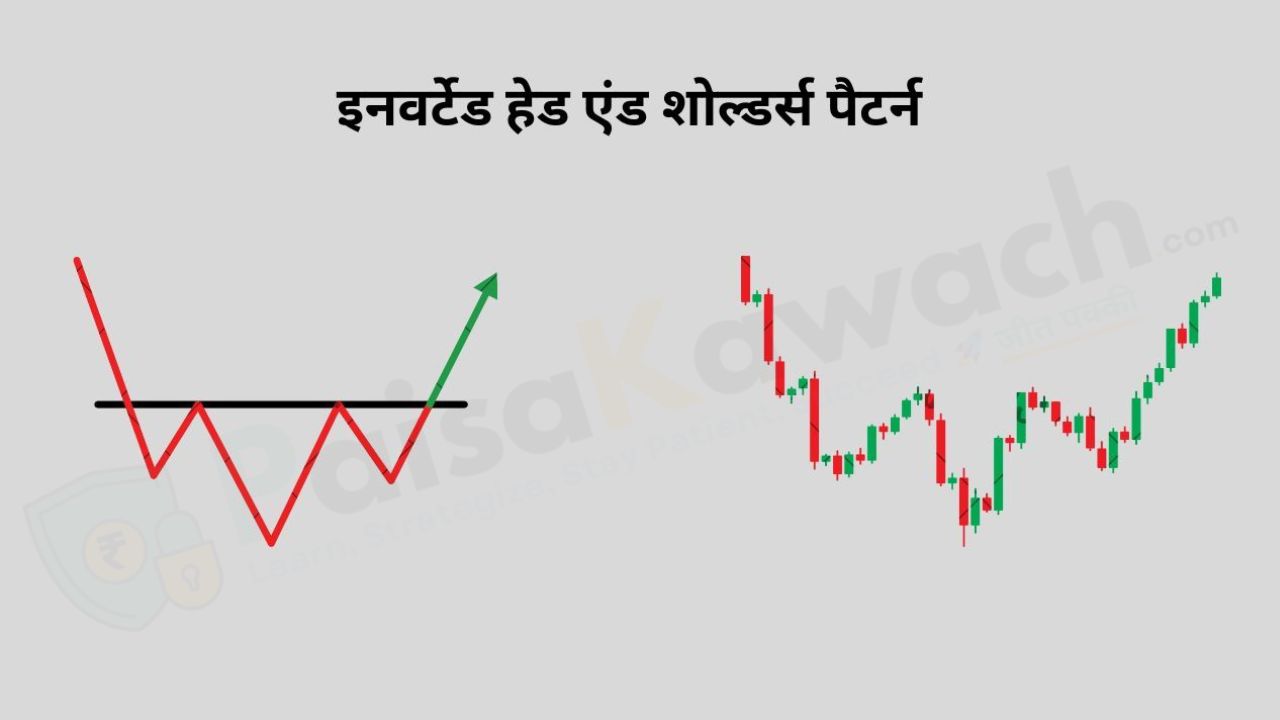
इन्वर्स हेड एंड शोल्डर्स: यह हेड एंड शोल्डर्स पैटर्न का उलटा संस्करण है और संभावित रिवर्सल का संकेत देता है, जहां डाउनट्रेंड अपट्रेंड में बदल सकता है। इस पैटर्न में तीन ट्रफ बनते हैं: बीच में सबसे निचला ट्रफ (हेड) और दोनों ओर दो उच्च ट्रफ (शोल्डर्स)। नेकलाइन से ऊपर ब्रेकआउट होने पर एक बुलिश ट्रेंड रिवर्सल का संकेत मिलता है।
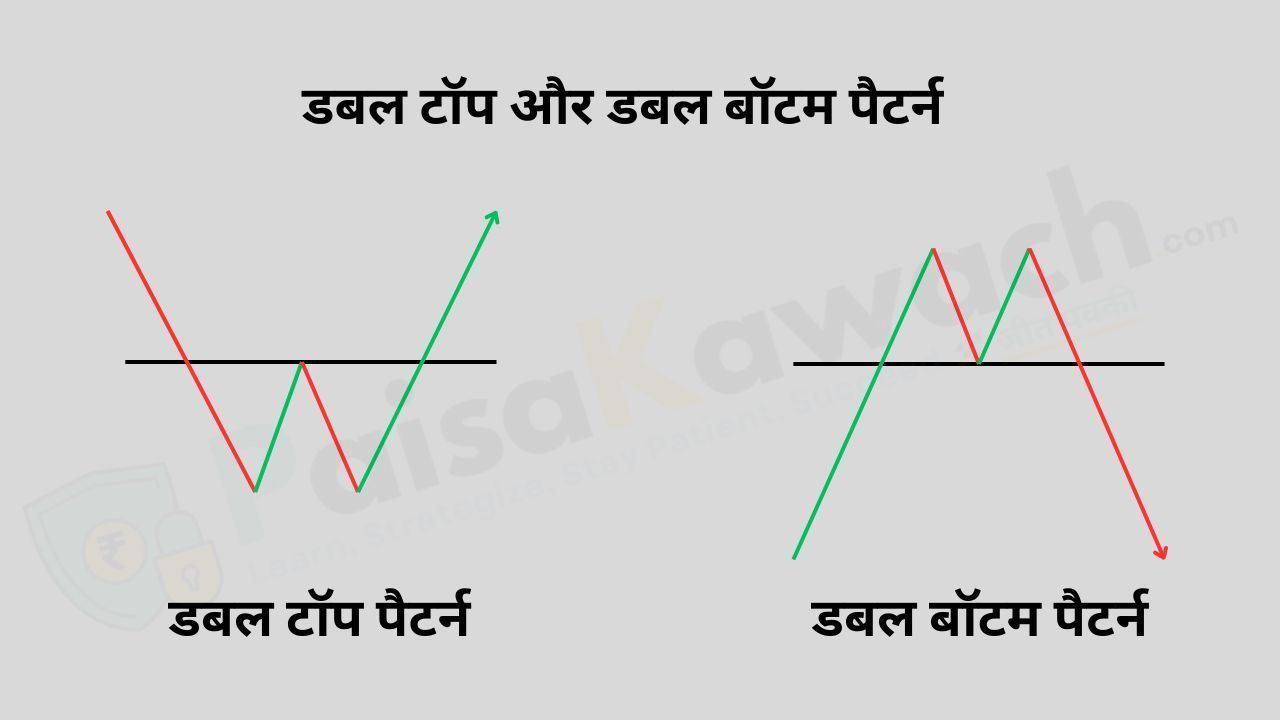
डबल टॉप और डबल बॉटम: डबल टॉप एक मंदी (बेयरिश) रिवर्सल पैटर्न है जो अपट्रेंड के बाद बनता है। इसमें लगभग समान स्तर पर दो चोटियाँ होती हैं, और फिर उनके बीच के ट्रफ से नीचे गिरने पर कीमत में गिरावट होती है। यह पैटर्न दर्शाता है कि दूसरी चोटी के बाद कीमत नीचे की ओर रुख करेगी। दूसरी ओर, डबल बॉटम एक तेजी (बुलिश) रिवर्सल पैटर्न है जो डाउनट्रेंड के बाद बनता है। इसमें लगभग समान स्तर पर दो ट्रफ होते हैं और उनके बीच की चोटी से ऊपर जाने पर कीमत अपट्रेंड की ओर बढ़ती है।
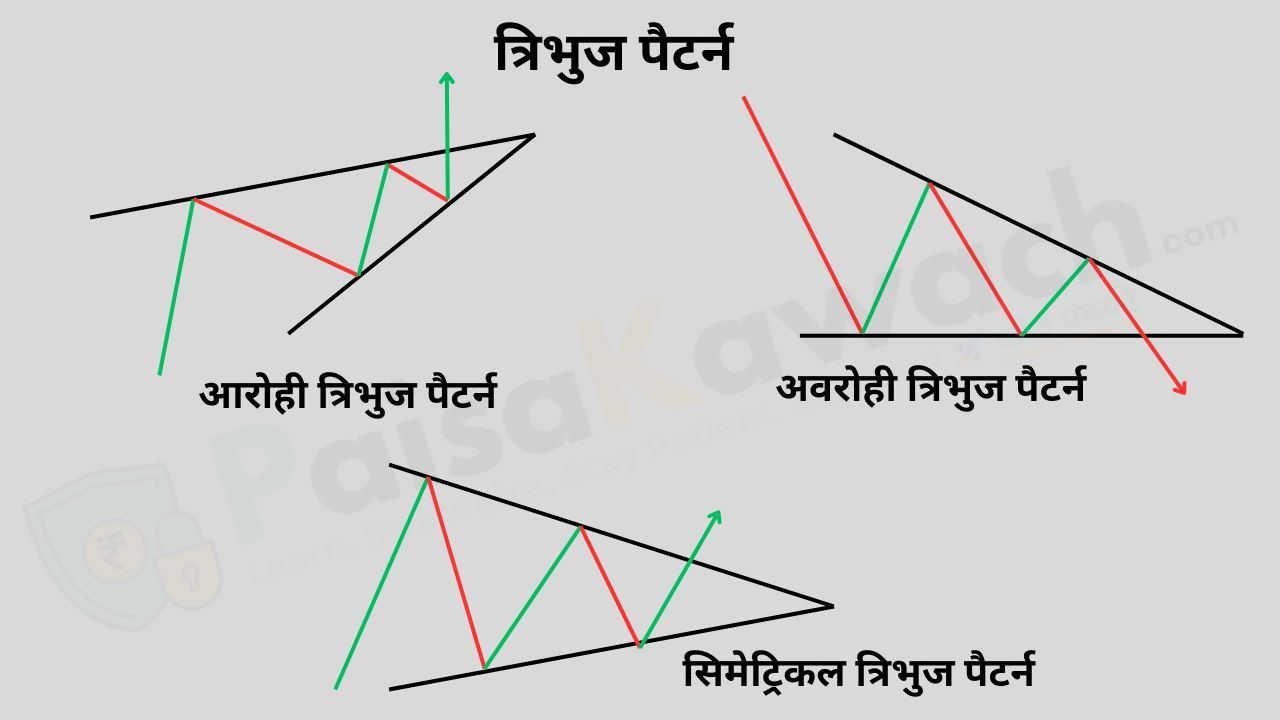
त्रिभुज (Triangles): त्रिभुज समेकन (Consolidation) पैटर्न होते हैं जो तब बनते हैं जब कीमत दो अभिसरण (Converging) ट्रेंड लाइनों के बीच संकीर्ण दायरे में चलती है। तीन मुख्य प्रकार के त्रिभुज होते हैं:
एस्केंडिंग ट्रायंगल (Ascending Triangle): इस पैटर्न की विशेषता ऊपरी स्तर पर एक क्षैतिज प्रतिरोध रेखा (Horizontal Resistance Line) और निचले स्तर पर एक ऊपर की ओर झुकी हुई समर्थन रेखा (Upward-Sloping Support Line) होती है। जब कीमत प्रतिरोध स्तर से ऊपर निकलती है, तो यह एक बुलिश ट्रेंड का संकेत देती है।
डिसेंडिंग ट्रायंगल (Descending Triangle): डिसेंडिंग ट्रायंगल में निचले स्तर पर एक क्षैतिज समर्थन रेखा (Horizontal Support Line) और ऊपरी स्तर पर एक नीचे की ओर झुकी हुई प्रतिरोध रेखा (Downward-Sloping Resistance Line) होती है। समर्थन रेखा से नीचे ब्रेकआउट होने पर यह एक मंदी (बेयरिश) ट्रेंड का संकेत देता है।
सिमेट्रिकल ट्रायंगल (Symmetrical Triangle): इस पैटर्न में दोनों समर्थन और प्रतिरोध रेखाएँ एक-दूसरे की ओर झुकती हैं, जिससे एक समेकन चरण का संकेत मिलता है। इस पैटर्न का ब्रेकआउट किसी भी दिशा में हो सकता है, जिससे यह बुलिश या बेयरिश हो सकता है।
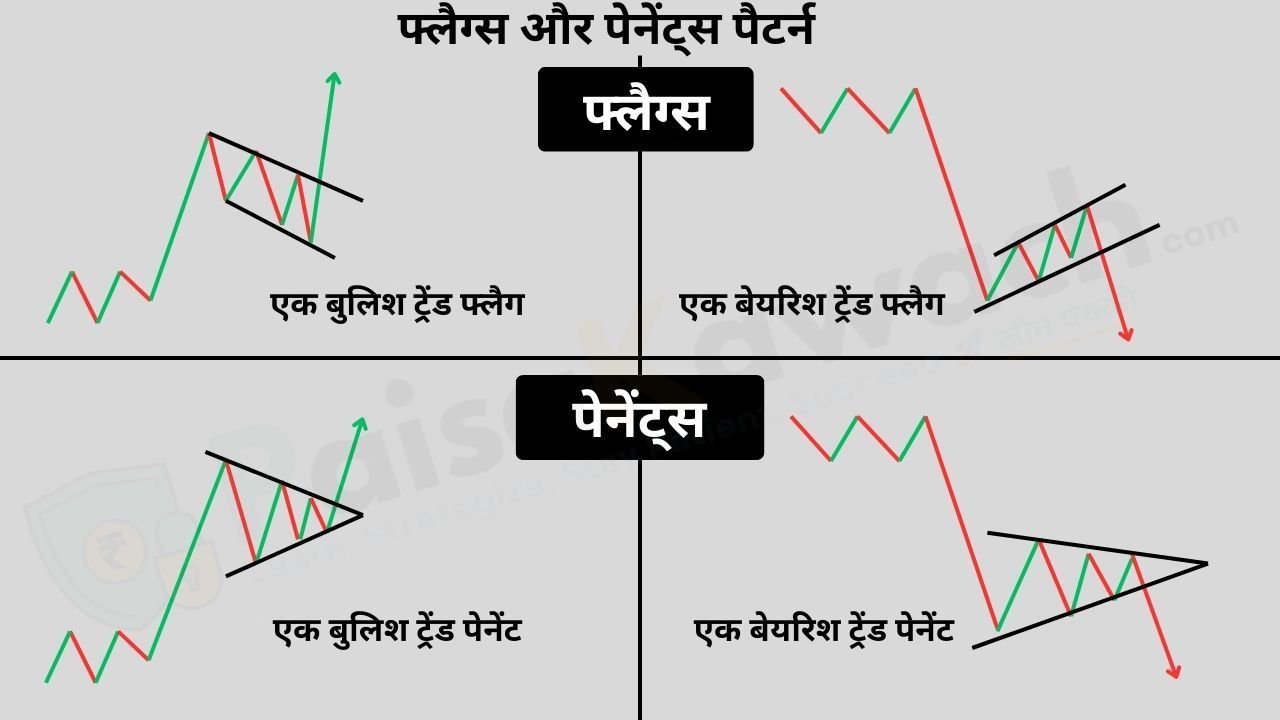
फ्लैग्स और पेनेंट्स: फ्लैग्स और पेनेंट्स छोटे समय के निरंतरता (Continuation) पैटर्न होते हैं जो एक मजबूत मूल्य चाल के बाद बनते हैं। फ्लैग एक आयताकार संकीर्ण समेकन क्षेत्र (Rectangular Consolidation) के रूप में बनता है, जो मौजूदा प्रवृत्ति के विरुद्ध झुका होता है, जबकि पेनेंट एक छोटा सिमेट्रिकल ट्रायंगल बनाता है। दोनों पैटर्न संकेत देते हैं कि मौजूदा ट्रेंड ब्रेकआउट के बाद जारी रहेगा।
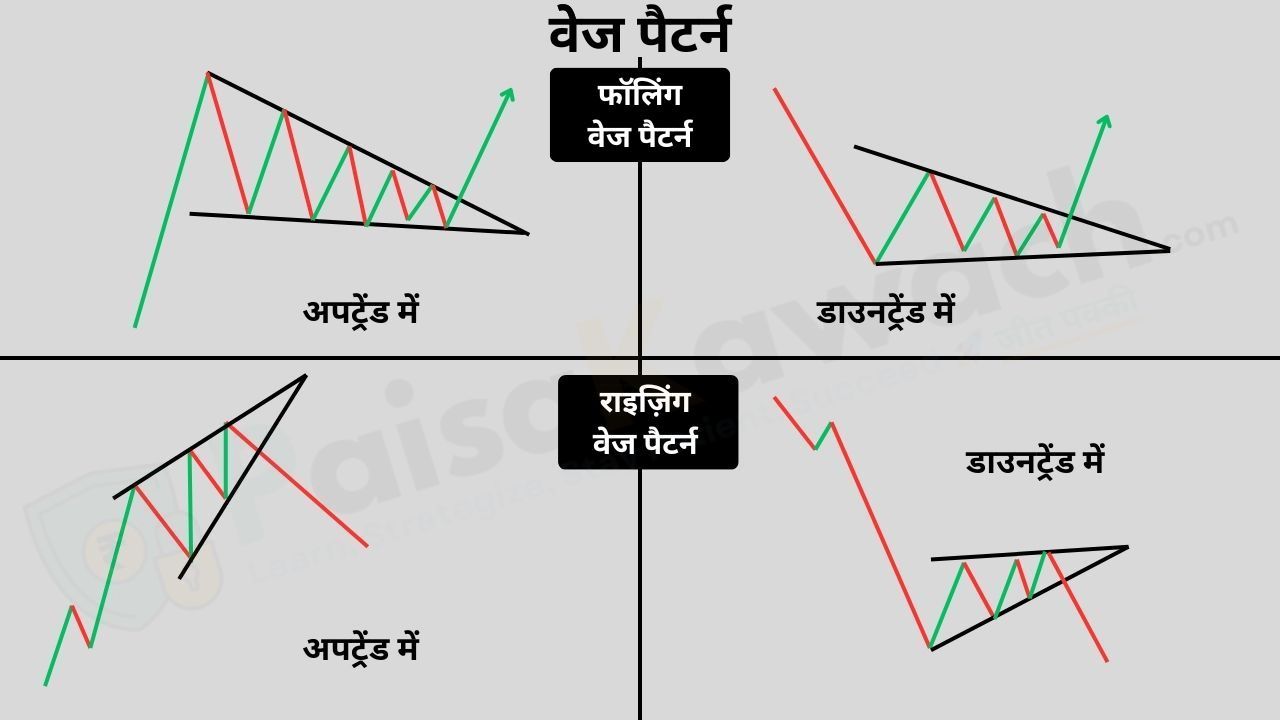
वेन्ज (Wedges): वेज पैटर्न एक प्रकार का समेकन पैटर्न होता है, जो अभिसरण ट्रेंड लाइनों के भीतर मूल्य गतिविधि के संकीर्ण होने को दर्शाता है। दो प्रकार के वेज पैटर्न होते हैं:
राइजिंग वेज (Rising Wedge): यह पैटर्न तब बनता है जब समर्थन और प्रतिरोध दोनों रेखाएँ ऊपर की ओर झुकती हैं, और यदि कीमत निचली ट्रेंडलाइन से नीचे टूटती है, तो यह एक संभावित मंदी (बेयरिश) रिवर्सल का संकेत देता है।
फॉलिंग वेज (Falling Wedge): यह पैटर्न तब बनता है जब समर्थन और प्रतिरोध दोनों रेखाएँ नीचे की ओर झुकती हैं, और यदि कीमत ऊपरी ट्रेंडलाइन से ऊपर टूटती है, तो यह एक संभावित तेजी (बुलिश) रिवर्सल का संकेत देता है।
व्यापारी चार्ट पैटर्न्स का उपयोग करके भविष्य की मूल्य चालों की भविष्यवाणी करते हैं और यह तय करते हैं कि व्यापार में कब प्रवेश या निकासी करें। चार्ट पैटर्न्स के साथ व्यापार करने के तरीके पर यहां बताया गया है:
ये उपकरण व्यापारियों को ट्रेंड की ताकत का मूल्यांकन करने, संभावित एंट्री और एग्जिट प्वाइंट्स पहचानने और जोखिम को प्रभावी ढंग से प्रबंधित करने में मदद करते हैं।
इन उपकरणों के संयोजन का विश्लेषण करके और उनके संकेतों को समझते हुए, व्यापारी भविष्य में मूल्य आंदोलनों का अनुमान लगाने की कोशिश करते हैं। तकनीकी विश्लेषण का उपयोग सभी प्रकार के बाजारों में किया जा सकता है, जैसे कि स्टॉक्स, फॉरेक्स, और क्रिप्टोकरेंसी। हालांकि, यह महत्वपूर्ण है कि ध्यान दें कि जबकि तकनीकी विश्लेषण व्यापार के सफल होने की संभावना को बढ़ा सकता है, यह पूर्ण रूप से सही नहीं होता। लंबी अवधि में सफल होने के लिए एक मजबूत जोखिम प्रबंधन रणनीति आवश्यक है।
तकनीकी विश्लेषण छोटे समयावधि के व्यापारियों के बीच खासकर लोकप्रिय है, जैसे कि दिन के व्यापारी (day traders) और स्विंग ट्रेडर्स (swing traders), जो तेजी से मूल्य परिवर्तनों से लाभ प्राप्त करने का प्रयास करते हैं। यह बुनियादी विश्लेषण से अलग होता है क्योंकि यह कंपनी के वित्तीय आंकड़ों और आर्थिक पहलुओं पर ध्यान केंद्रित करने के बजाय, पूरी तरह से मूल्य डेटा पर निर्भर करता है। इस कारण, यह तकनीकी विश्लेषण अस्थिर बाजारों में एंट्री और एग्जिट प्वाइंट्स पहचानने के लिए बहुत उपयुक्त बनाता है।
यह विशेष रूप से उन व्यापारियों के लिए फायदेमंद है, जो त्वरित निर्णय लेना चाहते हैं। तकनीकी विश्लेषण उन्हें बाजार के उतार-चढ़ाव को समझने और लाभ के अवसरों का फायदा उठाने के लिए मजबूत औजार प्रदान करता है। यहां इसके लाभों को विस्तार से समझें:
तकनीकी विश्लेषण का एक और प्रमुख फायदा यह है कि इसे किसी भी समयावधि में लागू किया जा सकता है। चाहे व्यापारी मिनट दर मिनट के उतार-चढ़ावों पर ध्यान दे या दीर्घकालिक रुझानों को ट्रैक करना चाहता हो, तकनीकी विश्लेषण इस पूरी प्रक्रिया में लचीलापन प्रदान करता है।
तकनीकी विश्लेषण की एक खासियत यह है कि यह बाहरी कारकों जैसे आय रिपोर्ट्स, राजनीतिक घटनाओं या समाचारों पर निर्भर नहीं करता। इससे व्यापारी बाहरी प्रभावित कारकों से मुक्त रहते हुए एक सुव्यवस्थित और नियम आधारित व्यापार दृष्टिकोण अपना सकते हैं।
इस प्रकार, तकनीकी विश्लेषण छोटे समयावधि के व्यापारियों के लिए एक अहम उपकरण है। यह उन्हें बाजार में उतार-चढ़ाव के दौरान तत्काल निर्णय लेने में मदद करता है और लचीलापन प्रदान करता है, जो किसी भी समयावधि में उनका मार्गदर्शन कर सकता है। यह किसी बाहरी घटना पर निर्भर न होकर केवल बाजार के आंकड़ों और संकेतकों पर आधारित होता है, जिससे यह एक भरोसेमंद और प्रभावी ट्रेडिंग रणनीति बनता है।
यह दृष्टिकोण खासकर उन व्यापारियों के बीच लोकप्रिय है जो छोटे समयावधि में मूल्य परिवर्तनों का लाभ उठाने की कोशिश करते हैं। उदाहरण के लिए, दिन के व्यापारी दिन भर में तेज़ मूल्य स्विंग्स की तलाश करते हैं, जबकि स्विंग ट्रेडर्स कुछ दिनों या हफ्तों तक स्थिति बनाए रखते हुए बड़े ट्रेंड्स को पकड़ने की कोशिश करते हैं।
Financial ratios are one of the most powerful tools in an investor’s arsenal when it comes to understanding a company's financial health. Imagine trying to evaluate a business without numbers—it would be like judging a book without ever opening it. These ratios distill complex financial data into simple, comparable metrics that provide deep insights into how well a company is performing.
At their core, financial ratios take raw numbers from a company’s financial statements—such as revenue, profit, debt, and assets—and put them into context. Instead of just knowing that a company made ₹100 crore in revenue, ratios help answer questions like: How efficiently did they generate that revenue? Are they making a good profit from it? Can they cover their debts? Are they growing sustainably?
Think of it this way—if two companies both report ₹1,000 crore in revenue, does that mean they are equally strong businesses? Not necessarily. One might be drowning in debt, while the other is running efficiently with high profit margins. Ratios help uncover these critical differences, making them invaluable to investors, analysts, and even business owners themselves.
These ratios broadly fall into different categories, each serving a unique purpose. Profitability ratios reveal how much profit a company is making from its sales and investments. Liquidity ratios show whether a company can meet its short-term obligations, while solvency ratios assess its ability to survive in the long run by managing debt effectively. Lastly, efficiency ratios highlight how well a company utilizes its resources to generate revenue.
A good investor doesn’t just look at one ratio in isolation. Instead, they compare multiple ratios over time and against competitors in the same industry. A company with a high profit margin but an extremely high debt-to-equity ratio, for example, might be profitable but also risky due to excessive borrowing. On the other hand, a company with solid liquidity but declining return on assets could be struggling with inefficiencies.
Ultimately, financial ratios don’t just provide numbers; they tell a story. They reveal whether a business is growing, struggling, or on the verge of something big. And for anyone looking to invest wisely, manage a business effectively, or simply understand the mechanics of financial success, these ratios are an essential guide.
These ratios measure a company's ability to generate profit relative to its revenue, assets, or equity.
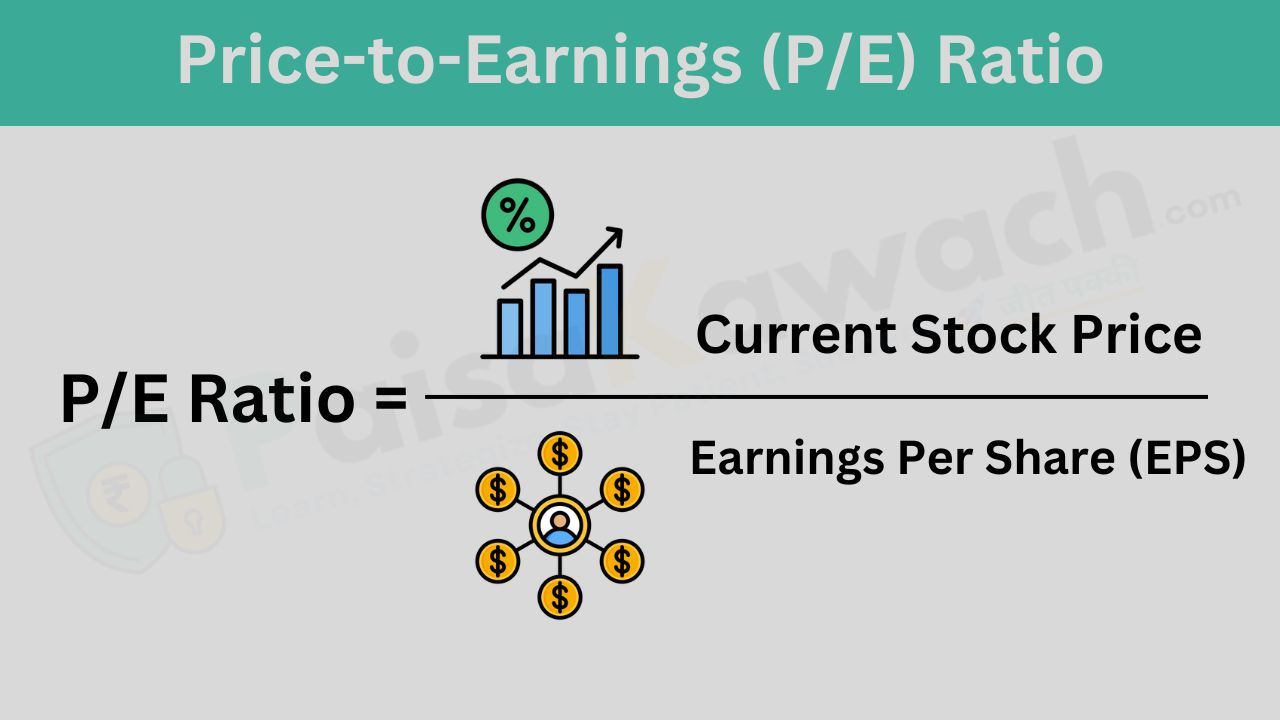
The Price-to-Earnings (P/E) Ratio is one of the most widely used financial metrics to assess whether a stock is overvalued, undervalued, or fairly priced. It tells investors how much they are willing to pay for each unit of earnings generated by the company.
The P/E Ratio is calculated using the following formula:
P/E Ratio = Current Stock Price ÷ Earnings Per Share (EPS)For example, if a company's stock is trading at ₹500 per share and its EPS (Earnings Per Share) is ₹25, the P/E Ratio will be:
500 ÷ 25 = 20This means investors are willing to pay ₹20 for every ₹1 of the company’s earnings.
Investors use the P/E Ratio for multiple purposes:
P/E Ratios vary significantly by industry. Comparing a company's P/E Ratio with its industry peers is a more meaningful way to assess valuation.
| Industry | Company | Stock Price (₹) | EPS (₹) | P/E Ratio |
|---|---|---|---|---|
| Technology | Company A | ₹2,000 | ₹50 | 40 |
| Banking | Company B | ₹800 | ₹40 | 20 |
| Pharmaceutical | Company C | ₹1,500 | ₹100 | 15 |
As seen above, the P/E Ratio differs based on industry expectations and business growth potential.

Return on Equity (ROE) is a crucial financial metric that measures a company's ability to generate profits from its shareholders' equity. It essentially tells investors how effectively a company is using the money invested by shareholders to generate earnings.
The ROE is calculated using the following formula:
ROE = (Net Income ÷ Shareholders' Equity) × 100For example, if a company has a net income of ₹10 crore and shareholders’ equity of ₹50 crore, its ROE would be:
ROE = (10 ÷ 50) × 100 = 20%This means the company is generating a 20% return on the money invested by its shareholders.
ROE is widely used by investors to assess a company’s financial health and efficiency. A higher ROE generally indicates:
However, a very high ROE can sometimes indicate excessive debt, which can be risky.
Different industries have different average ROE benchmarks. Below is a comparison:
| Industry | Company | Net Income (₹ Cr) | Shareholders’ Equity (₹ Cr) | ROE (%) |
|---|---|---|---|---|
| Technology | Company A | ₹12 Cr | ₹40 Cr | 30% |
| Banking | Company B | ₹15 Cr | ₹100 Cr | 15% |
| Pharmaceutical | Company C | ₹8 Cr | ₹50 Cr | 16% |
Comparing ROE within the same industry helps investors determine which companies are performing better in utilizing shareholder capital.
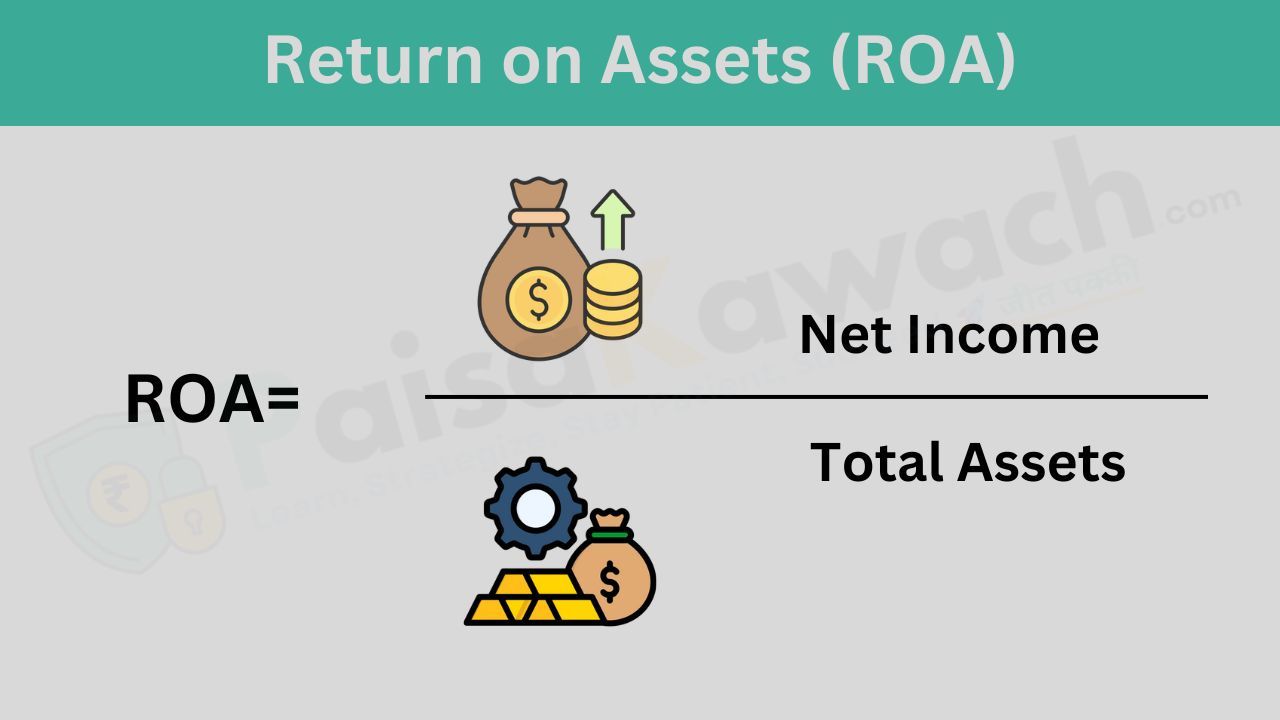
Return on Assets (ROA) is a key financial metric that measures how efficiently a company utilizes its total assets to generate profits. It provides insight into a company’s operational efficiency by showing how much profit is earned per unit of assets.
The ROA is calculated using the following formula:
ROA = (Net Income ÷ Total Assets) × 100For example, if a company has a net income of ₹8 crore and total assets worth ₹40 crore, its ROA would be:
ROA = (8 ÷ 40) × 100 = 20%This means the company generates a 20% return on its total assets.
ROA is a crucial measure of financial efficiency, and a higher ROA generally indicates:
However, a low ROA may indicate poor asset utilization, excessive overhead costs, or inefficiencies in business operations.
ROA varies across industries. Below is a comparison:
| Industry | Company | Net Income (₹ Cr) | Total Assets (₹ Cr) | ROA (%) |
|---|---|---|---|---|
| Retail | Company X | ₹5 Cr | ₹50 Cr | 10% |
| Automobile | Company Y | ₹15 Cr | ₹75 Cr | 20% |
| Technology | Company Z | ₹12 Cr | ₹60 Cr | 20% |
Comparing ROA across industries helps investors determine which companies are most efficient at utilizing their assets to generate profits.
Liquidity ratios assess a company's ability to meet short-term obligations using its current assets.
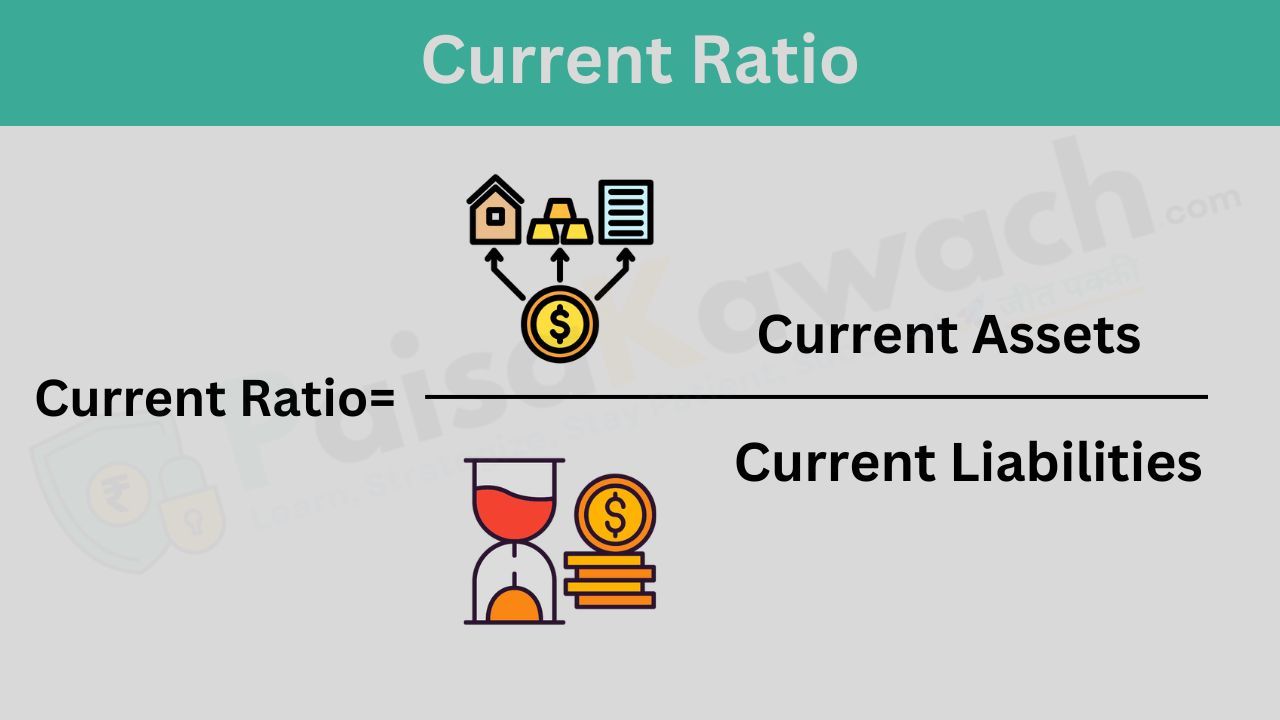
Current Ratio is a key liquidity metric that evaluates a company's ability to meet its short-term obligations using its short-term assets. It measures how well a company can cover its current liabilities with its current assets.
The Current Ratio is calculated using the following formula:
Current Ratio = Current Assets ÷ Current LiabilitiesFor example, if a company has ₹50 crore in current assets and ₹25 crore in current liabilities, its Current Ratio would be:
Current Ratio = 50 ÷ 25 = 2.0This means the company has twice the assets required to cover its short-term liabilities, indicating strong liquidity.
The Current Ratio is an important indicator of financial stability. A higher Current Ratio generally indicates:
However, a very high Current Ratio (e.g., above 3.0) may indicate inefficient use of assets, while a low Current Ratio (below 1.0) suggests liquidity problems.
Different industries have different benchmarks for the Current Ratio. Below is a comparison:
| Industry | Company | Current Assets (₹ Cr) | Current Liabilities (₹ Cr) | Current Ratio |
|---|---|---|---|---|
| Retail | Company A | ₹30 Cr | ₹20 Cr | 1.5 |
| Manufacturing | Company B | ₹100 Cr | ₹50 Cr | 2.0 |
| Pharmaceutical | Company C | ₹60 Cr | ₹30 Cr | 2.0 |
Comparing the Current Ratio within the same industry helps investors understand a company’s short-term financial health and risk exposure.
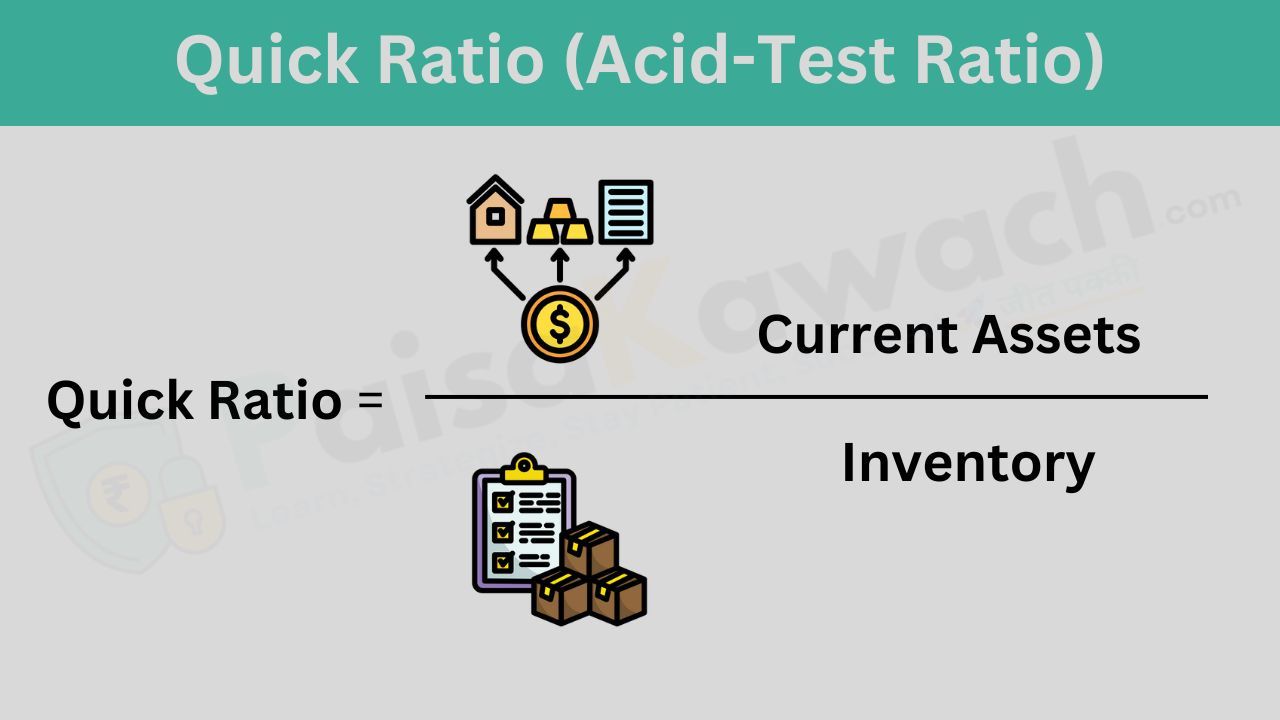
Quick Ratio, also known as the Acid-Test Ratio, is a more stringent liquidity measure compared to the Current Ratio. It evaluates a company’s ability to meet short-term obligations using its most liquid assets while excluding inventory.
Since inventory may take time to sell, the Quick Ratio provides a more realistic picture of a company's immediate financial strength.
The Quick Ratio is calculated using the following formula:
Quick Ratio = (Current Assets - Inventory) ÷ Current LiabilitiesFor example, if a company has:
The Quick Ratio would be:
Quick Ratio = (50 - 20) ÷ 25 = 1.2This means the company has ₹1.20 in highly liquid assets for every ₹1 of short-term liabilities.
The Quick Ratio is a crucial financial metric as it:
A Quick Ratio above 1.0 generally indicates strong liquidity, while a ratio below 1.0 suggests potential liquidity concerns.
Different industries have different benchmarks for the Quick Ratio. Below is a comparison:
| Industry | Company | Current Assets (₹ Cr) | Inventory (₹ Cr) | Current Liabilities (₹ Cr) | Quick Ratio |
|---|---|---|---|---|---|
| Retail | Company A | ₹30 Cr | ₹10 Cr | ₹20 Cr | 1.0 |
| Manufacturing | Company B | ₹100 Cr | ₹50 Cr | ₹50 Cr | 1.0 |
| Pharmaceutical | Company C | ₹60 Cr | ₹10 Cr | ₹30 Cr | 1.67 |
Investors and analysts use the Quick Ratio to compare a company’s liquidity strength within its industry.
These ratios indicate a company's long-term financial stability and ability to meet debt obligations.
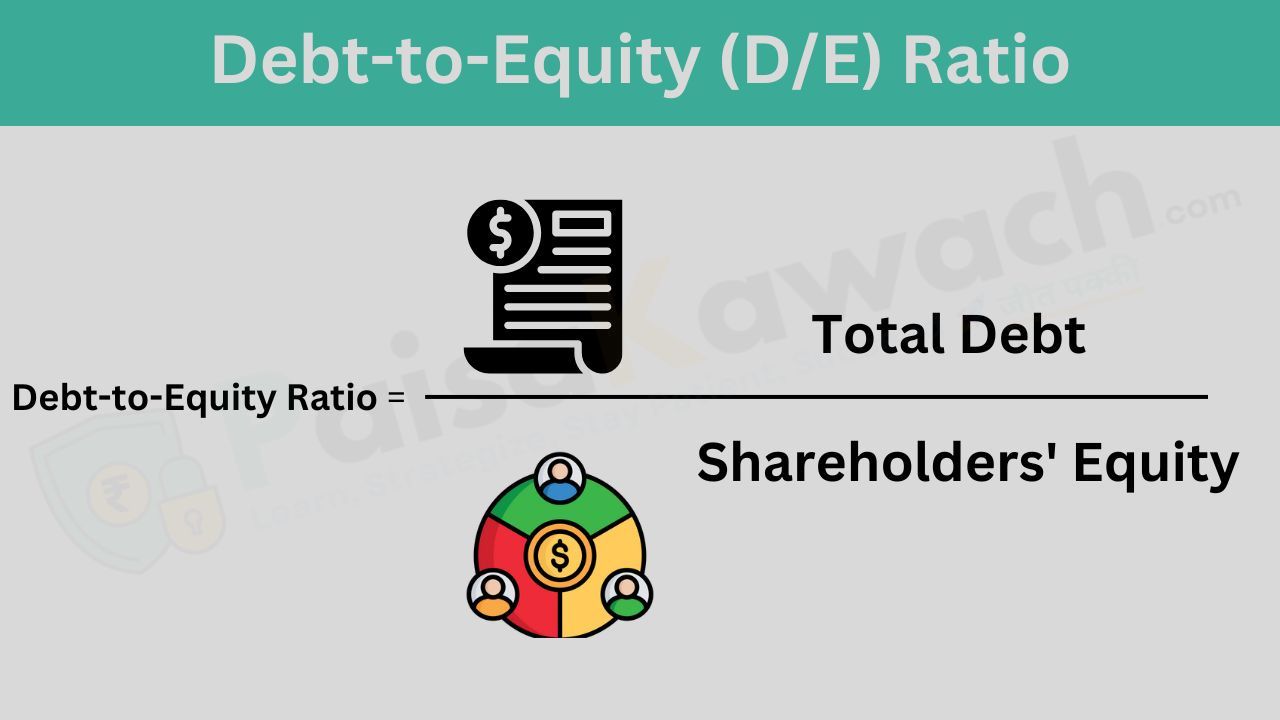
The Debt-to-Equity (D/E) Ratio is a key financial metric that measures a company's financial leverage by comparing its total debt to shareholders' equity.
This ratio helps investors and analysts assess how much a company is relying on borrowed funds to finance its operations versus using its own capital. A higher D/E ratio suggests that the company is heavily financed by debt, which may indicate higher financial risk.
The D/E ratio is calculated using the following formula:
Debt-to-Equity Ratio = Total Debt ÷ Shareholders' EquityFor example, if a company has:
The Debt-to-Equity Ratio would be:
D/E Ratio = 100 ÷ 200 = 0.5This means the company has ₹0.50 of debt for every ₹1 of shareholders' equity.
A company’s D/E ratio is crucial for evaluating financial risk. A low D/E ratio usually indicates:
However, a very low D/E ratio may also indicate that a company is not taking full advantage of leverage for expansion.
Different industries have different acceptable D/E ratios. Below is a comparison:
| Industry | Company | Total Debt (₹ Cr) | Shareholders’ Equity (₹ Cr) | D/E Ratio |
|---|---|---|---|---|
| Technology | Company A | ₹50 Cr | ₹200 Cr | 0.25 |
| Banking | Company B | ₹300 Cr | ₹250 Cr | 1.2 |
| Manufacturing | Company C | ₹100 Cr | ₹150 Cr | 0.67 |
Investors use this ratio to compare financial risk between companies in the same sector.
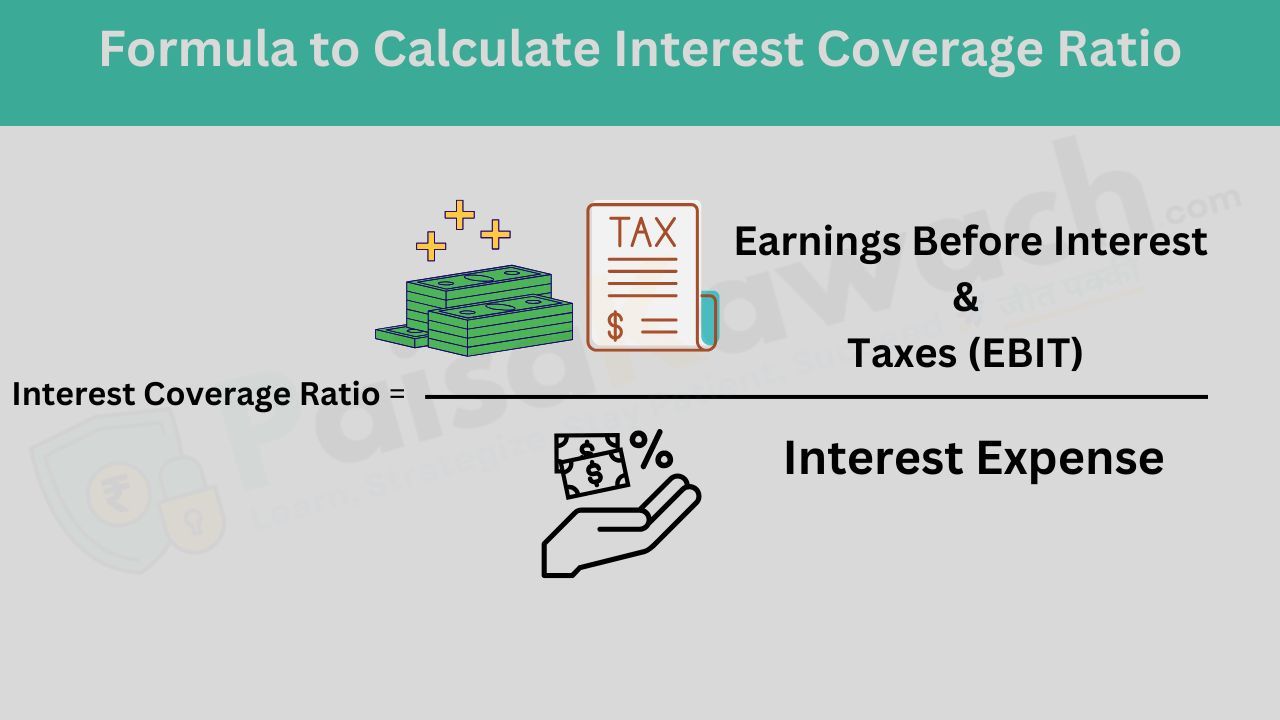
The Interest Coverage Ratio is a crucial financial metric that measures how easily a company can pay its interest expenses using its earnings.
It indicates the company’s ability to meet its interest obligations on outstanding debt. A higher interest coverage ratio suggests that the company has sufficient earnings to cover interest payments, while a lower ratio may signal financial stress.
The Interest Coverage Ratio is calculated as:
Interest Coverage Ratio = Earnings Before Interest & Taxes (EBIT) ÷ Interest ExpenseFor example, if a company has:
The Interest Coverage Ratio would be:
Interest Coverage Ratio = 50 ÷ 10 = 5This means the company earns 5 times the amount required to cover its interest expenses.
The Interest Coverage Ratio is a key indicator of financial stability. A higher ratio generally means:
However, an excessively high ratio may indicate that the company is not utilizing leverage effectively for expansion.
Different industries have different acceptable Interest Coverage Ratios. Below is a comparison:
| Industry | Company | EBIT (₹ Cr) | Interest Expense (₹ Cr) | Interest Coverage Ratio |
|---|---|---|---|---|
| Technology | Company A | ₹100 Cr | ₹10 Cr | 10 |
| Banking | Company B | ₹150 Cr | ₹50 Cr | 3 |
| Manufacturing | Company C | ₹80 Cr | ₹20 Cr | 4 |
Investors and lenders analyze this ratio to determine how comfortably a company can handle its debt obligations.
Efficiency ratios analyze how effectively a company utilizes its assets and liabilities to generate revenue.
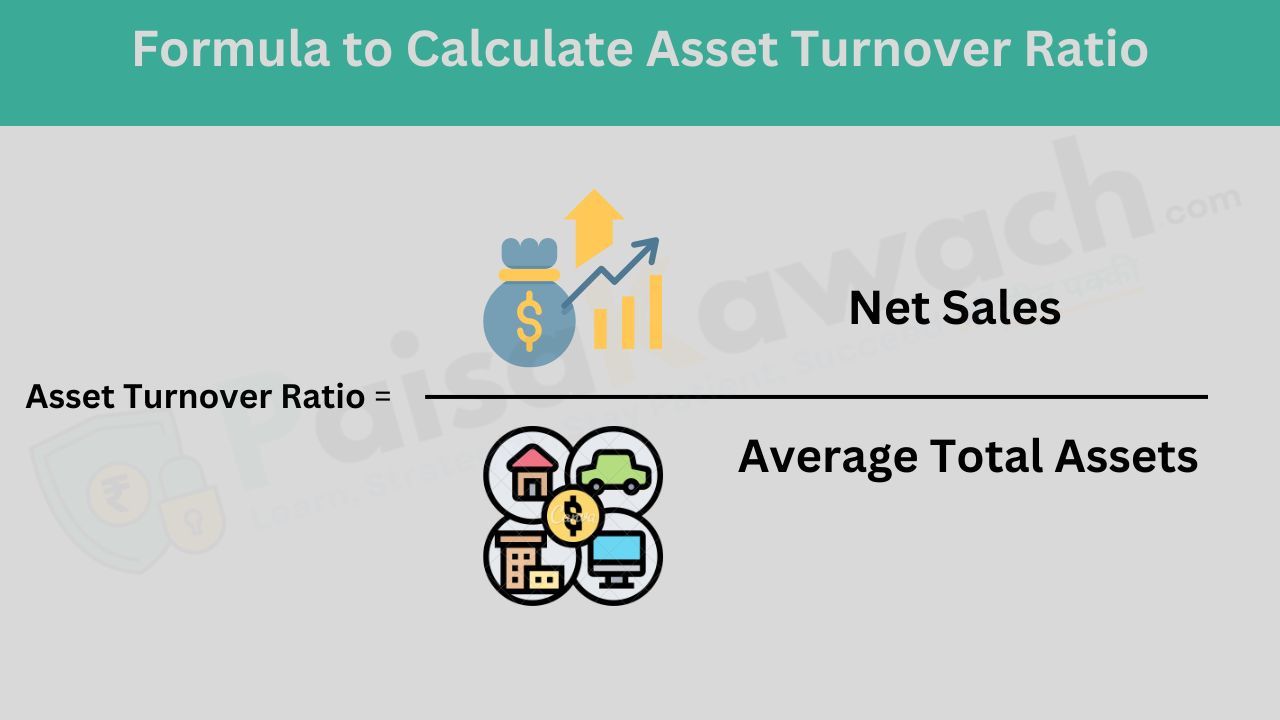
The Asset Turnover Ratio is a key financial metric that measures how efficiently a company utilizes its assets to generate revenue.
It indicates how many times a company’s total assets are turned into sales within a given period. A higher Asset Turnover Ratio suggests that the company is utilizing its assets efficiently, while a lower ratio may indicate underutilization or inefficiencies in operations.
The Asset Turnover Ratio is calculated as:
Asset Turnover Ratio = Net Sales ÷ Average Total AssetsFor example, if a company has:
The Asset Turnover Ratio would be:
Asset Turnover Ratio = 200 ÷ 100 = 2This means the company generates ₹2 in sales for every ₹1 of assets it owns.
The Asset Turnover Ratio is an important indicator of operational efficiency. A higher ratio generally means:
However, a very high ratio may indicate that the company is not investing enough in long-term assets, which could limit future growth.
Different industries have different benchmark values for the Asset Turnover Ratio. Below is a comparison:
| Industry | Company | Net Sales (₹ Cr) | Average Total Assets (₹ Cr) | Asset Turnover Ratio |
|---|---|---|---|---|
| Retail | Company A | ₹500 Cr | ₹200 Cr | 2.5 |
| Manufacturing | Company B | ₹300 Cr | ₹150 Cr | 2.0 |
| Telecom | Company C | ₹200 Cr | ₹300 Cr | 0.67 |
Comparing the Asset Turnover Ratio within the same industry helps investors understand how efficiently a company is utilizing its assets relative to competitors.
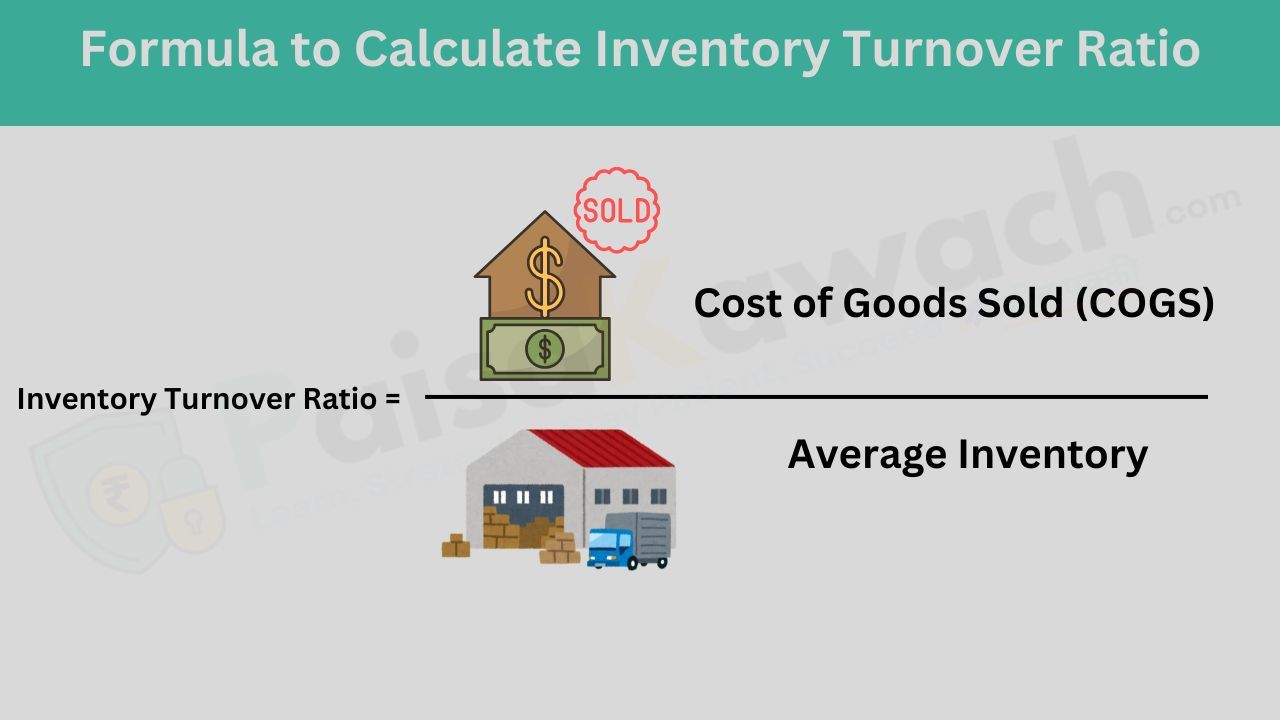
The Inventory Turnover Ratio is a crucial financial metric that measures how efficiently a company manages its inventory by determining how quickly goods are sold and replaced over a given period.
A higher Inventory Turnover Ratio suggests strong sales and effective inventory management, while a lower ratio may indicate overstocking, slow sales, or poor demand forecasting.
The Inventory Turnover Ratio is calculated as:
Inventory Turnover Ratio = Cost of Goods Sold (COGS) ÷ Average InventoryFor example, if a company has:
The Inventory Turnover Ratio would be:
Inventory Turnover Ratio = 500 ÷ 100 = 5This means the company sells and replaces its entire inventory 5 times in a year.
The Inventory Turnover Ratio helps businesses optimize stock levels and improve profitability. A higher ratio generally indicates:
However, an excessively high ratio may suggest frequent stockouts, leading to missed sales opportunities.
Different industries have varying benchmarks for the Inventory Turnover Ratio. Below is a comparison:
| Industry | Company | COGS (₹ Cr) | Average Inventory (₹ Cr) | Inventory Turnover Ratio |
|---|---|---|---|---|
| Retail | Company A | ₹600 Cr | ₹100 Cr | 6 |
| Manufacturing | Company B | ₹400 Cr | ₹150 Cr | 2.67 |
| Pharmaceutical | Company C | ₹300 Cr | ₹75 Cr | 4 |
Analyzing the Inventory Turnover Ratio within the same industry helps investors and businesses determine how efficiently a company is managing its stock compared to competitors.
By analyzing these financial ratios, investors can make data-driven comparisons between companies in the same industry, assess financial strengths and weaknesses, and make informed investment decisions.

वित्तीय अनुपात किसी भी व्यवसाय को समझने का एक शक्तिशाली तरीका है। बिना संख्याओं के किसी कंपनी का विश्लेषण करना ऐसा ही होगा जैसे बिना किताब खोले उसकी समीक्षा करना। ये अनुपात जटिल वित्तीय आंकड़ों को सरल और तुलनात्मक मेट्रिक्स में बदलते हैं, जिससे यह पता चलता है कि कोई कंपनी कितनी अच्छी तरह से प्रदर्शन कर रही है।
मूल रूप से, वित्तीय अनुपात किसी कंपनी के वित्तीय विवरणों से प्राप्त आंकड़ों—जैसे कि राजस्व, लाभ, ऋण और संपत्ति—को एक परिप्रेक्ष्य में रखते हैं। केवल यह जानना कि किसी कंपनी ने ₹100 करोड़ का राजस्व अर्जित किया, पर्याप्त नहीं है। असली सवाल यह है कि क्या वे यह राजस्व कुशलता से उत्पन्न कर रहे हैं? क्या वे वास्तव में इससे लाभ कमा रहे हैं? क्या उनके पास अपने ऋण चुकाने की क्षमता है? क्या उनकी वृद्धि टिकाऊ है?
उदाहरण के लिए, मान लीजिए कि दो कंपनियों ने ₹1,000 करोड़ का राजस्व अर्जित किया। क्या इसका मतलब यह है कि दोनों समान रूप से सफल हैं? बिल्कुल नहीं! हो सकता है कि एक कंपनी पर भारी ऋण हो और वह मुश्किल में हो, जबकि दूसरी कंपनी अधिक लाभदायक और वित्तीय रूप से स्थिर हो। वित्तीय अनुपात इन महत्वपूर्ण अंतर को उजागर करने में मदद करते हैं, जो उन्हें निवेशकों, विश्लेषकों और यहां तक कि स्वयं व्यापार मालिकों के लिए भी अनिवार्य बना देते हैं।
वित्तीय अनुपात मुख्य रूप से कुछ प्रमुख श्रेणियों में विभाजित किए जाते हैं, जिनमें से प्रत्येक का एक विशेष उद्देश्य होता है। लाभप्रदता अनुपात यह दर्शाता है कि कंपनी अपनी बिक्री और निवेश से कितना लाभ कमा रही है। तरलता अनुपात यह दिखाता है कि क्या कंपनी अपनी अल्पकालिक देनदारियों को पूरा करने में सक्षम है, जबकि सॉल्वेंसी अनुपात यह मापता है कि क्या कंपनी दीर्घकालिक रूप से वित्तीय स्थिरता बनाए रख सकती है। इसके अलावा, दक्षता अनुपात दर्शाता है कि कंपनी अपने संसाधनों का उपयोग कितनी प्रभावी ढंग से कर रही है।
एक समझदार निवेशक कभी भी केवल एक अनुपात को अलग से नहीं देखता, बल्कि वह कई अनुपातों की तुलना करता है—समय के साथ और उद्योग में अन्य कंपनियों के मुकाबले। उदाहरण के लिए, यदि किसी कंपनी का लाभ मार्जिन बहुत अधिक है लेकिन उसका ऋण-से-इक्विटी अनुपात भी बहुत ऊँचा है, तो इसका मतलब हो सकता है कि कंपनी लाभदायक तो है, लेकिन अधिक ऋण लेकर काम कर रही है, जिससे उसमें जोखिम बढ़ जाता है। इसी तरह, यदि किसी कंपनी की तरलता मजबूत है लेकिन संपत्तियों पर रिटर्न घट रहा है, तो यह संकेत हो सकता है कि कंपनी अपनी संपत्तियों का सही उपयोग नहीं कर पा रही है।
अंततः, वित्तीय अनुपात सिर्फ संख्याएँ नहीं हैं, वे एक कहानी बयां करते हैं। वे यह प्रकट करते हैं कि कोई व्यवसाय बढ़ रहा है, संघर्ष कर रहा है, या सफलता की कगार पर है। इसलिए, चाहे आप एक निवेशक हों, एक व्यापारी हों, या सिर्फ वित्तीय सफलता के नियमों को समझना चाहते हों, इन अनुपातों को समझना आपके लिए बेहद फायदेमंद होगा।
ये अनुपात यह मापते हैं कि कोई कंपनी अपने राजस्व, संपत्ति या इक्विटी के सापेक्ष कितना लाभ उत्पन्न कर सकती है।
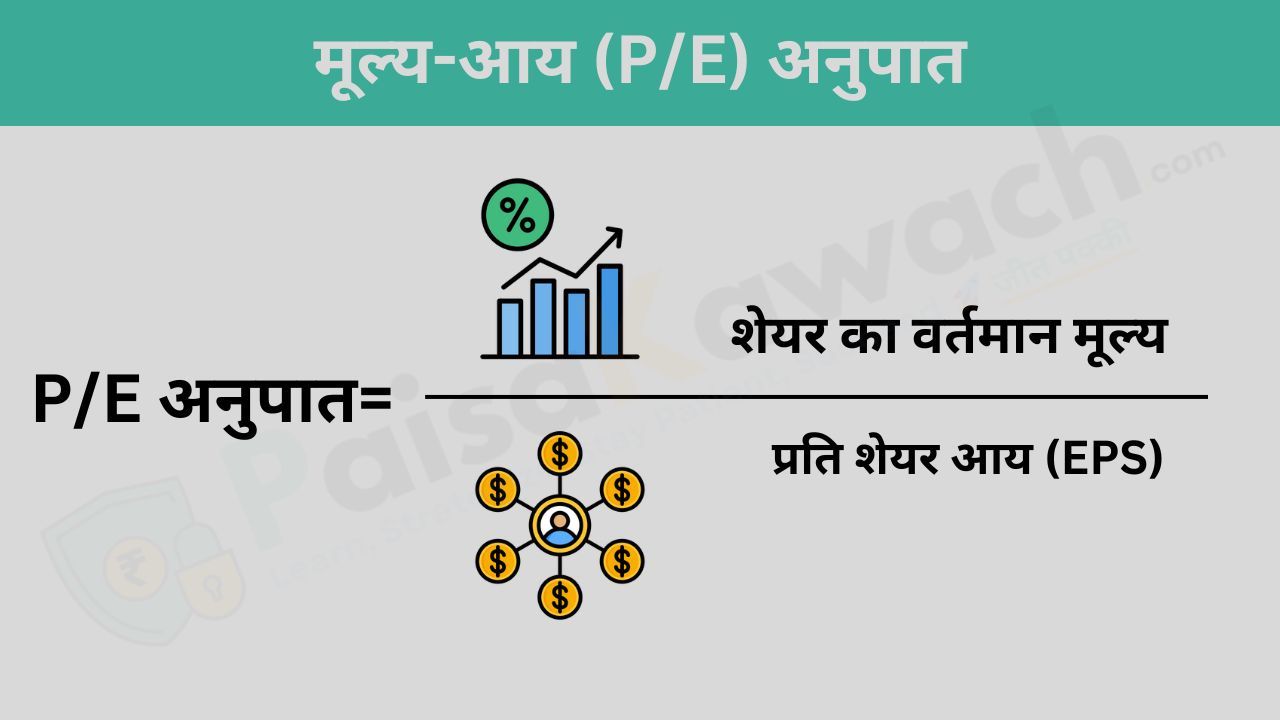
मूल्य-आय (P/E) अनुपात एक महत्वपूर्ण वित्तीय मापदंड है जो यह बताता है कि निवेशक किसी कंपनी की प्रति इकाई आय (Earnings Per Share - EPS) के बदले कितना भुगतान करने के लिए तैयार हैं। यह मूल्यांकन करने में मदद करता है कि कोई स्टॉक अधिक मूल्यवान, कम मूल्यवान या उचित मूल्य का है।
P/E अनुपात निम्नलिखित सूत्र से निकाला जाता है:
P/E अनुपात = शेयर का वर्तमान मूल्य ÷ प्रति शेयर आय (EPS)उदाहरण के लिए, यदि किसी कंपनी का स्टॉक ₹500 प्रति शेयर पर ट्रेड कर रहा है और उसकी प्रति शेयर आय (EPS) ₹25 है, तो P/E अनुपात होगा:
500 ÷ 25 = 20इसका मतलब है कि निवेशक कंपनी की प्रति ₹1 आय के बदले ₹20 का भुगतान करने के लिए तैयार हैं।
निवेशक विभिन्न उद्देश्यों के लिए P/E अनुपात का उपयोग करते हैं:
P/E अनुपात अलग-अलग उद्योगों में भिन्न होता है। किसी कंपनी के P/E अनुपात की तुलना उसके प्रतिस्पर्धियों से करना अधिक उचित होता है।
| उद्योग | कंपनी | शेयर मूल्य (₹) | EPS (₹) | P/E अनुपात |
|---|---|---|---|---|
| प्रौद्योगिकी | कंपनी A | ₹2,000 | ₹50 | 40 |
| बैंकिंग | कंपनी B | ₹800 | ₹40 | 20 |
| फार्मास्यूटिकल | कंपनी C | ₹1,500 | ₹100 | 15 |
जैसा कि देखा जा सकता है, विभिन्न उद्योगों में P/E अनुपात भिन्न होता है, जो व्यापार की संभावनाओं और बाजार की अपेक्षाओं पर निर्भर करता है।
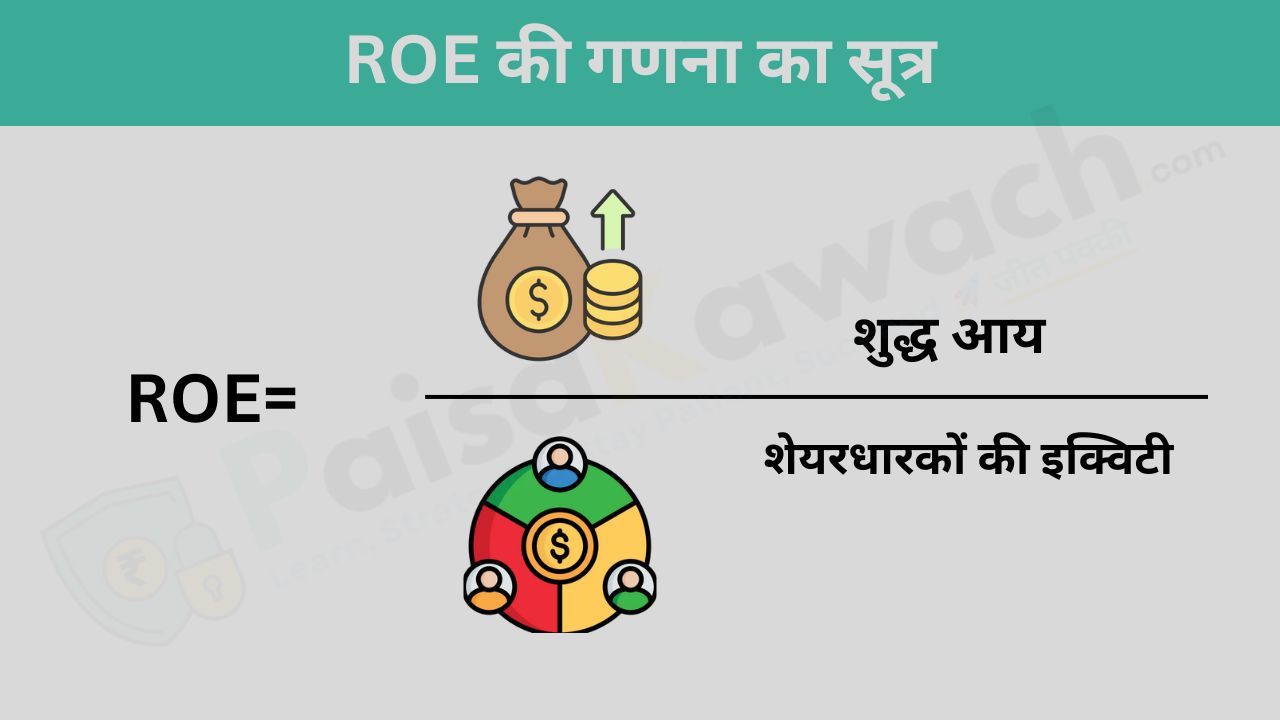
शेयरधारकों की इक्विटी पर रिटर्न (ROE) एक महत्वपूर्ण वित्तीय अनुपात है जो यह मापता है कि कोई कंपनी अपने शेयरधारकों की इक्विटी से कितनी प्रभावी रूप से लाभ उत्पन्न कर रही है। यह निवेशकों को यह समझने में मदद करता है कि कंपनी अपने शेयरधारकों द्वारा निवेश किए गए पैसे का उपयोग कितनी कुशलता से कर रही है।
ROE की गणना निम्नलिखित सूत्र से की जाती है:
ROE = (शुद्ध आय ÷ शेयरधारकों की इक्विटी) × 100उदाहरण के लिए, यदि किसी कंपनी की शुद्ध आय ₹10 करोड़ और शेयरधारकों की इक्विटी ₹50 करोड़ है, तो उसका ROE होगा:
ROE = (10 ÷ 50) × 100 = 20%इसका मतलब है कि कंपनी अपने शेयरधारकों के निवेश पर 20% रिटर्न कमा रही है।
ROE का उपयोग निवेशक कंपनी के वित्तीय स्वास्थ्य और दक्षता का मूल्यांकन करने के लिए करते हैं। एक उच्च ROE आमतौर पर इंगित करता है:
हालांकि, बहुत अधिक ROE कभी-कभी अत्यधिक ऋण (Debt) का संकेत भी हो सकता है, जो जोखिम भरा हो सकता है।
विभिन्न उद्योगों में ROE के औसत मान अलग-अलग होते हैं। नीचे एक तुलना दी गई है:
| उद्योग | कंपनी | शुद्ध आय (₹ करोड़) | शेयरधारकों की इक्विटी (₹ करोड़) | ROE (%) |
|---|---|---|---|---|
| प्रौद्योगिकी | कंपनी A | ₹12 करोड़ | ₹40 करोड़ | 30% |
| बैंकिंग | कंपनी B | ₹15 करोड़ | ₹100 करोड़ | 15% |
| फार्मास्यूटिकल | कंपनी C | ₹8 करोड़ | ₹50 करोड़ | 16% |
उद्योग के भीतर ROE की तुलना करके निवेशक यह समझ सकते हैं कि कौन सी कंपनियां अपने शेयरधारकों की पूंजी का सबसे अच्छा उपयोग कर रही हैं।
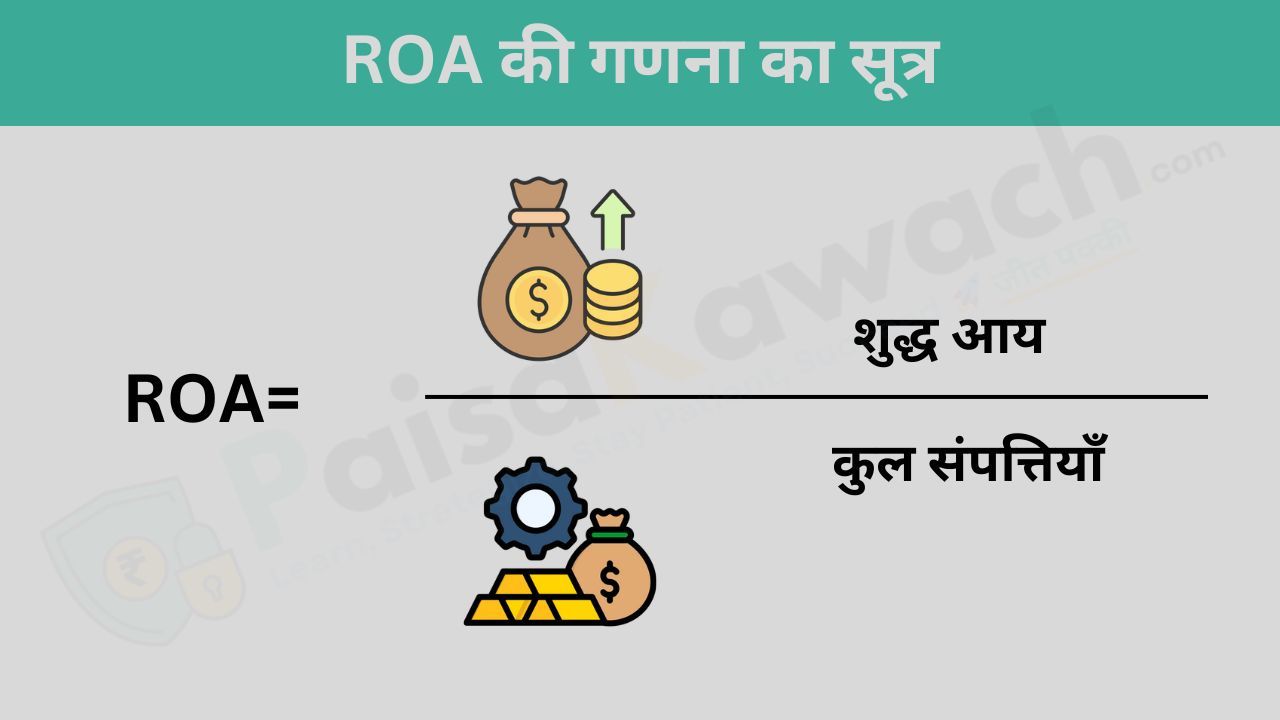
संपत्तियों पर रिटर्न (ROA) एक महत्वपूर्ण वित्तीय अनुपात है जो यह मापता है कि कोई कंपनी अपने कुल संपत्तियों का उपयोग करके कितनी कुशलता से लाभ उत्पन्न कर रही है। यह कंपनी की संचालन दक्षता को दर्शाता है और बताता है कि प्रत्येक संपत्ति इकाई पर कितना लाभ अर्जित किया जा रहा है।
ROA की गणना निम्नलिखित सूत्र से की जाती है:
ROA = (शुद्ध आय ÷ कुल संपत्तियाँ) × 100उदाहरण के लिए, यदि किसी कंपनी की शुद्ध आय ₹8 करोड़ और कुल संपत्तियाँ ₹40 करोड़ हैं, तो उसका ROA होगा:
ROA = (8 ÷ 40) × 100 = 20%इसका मतलब है कि कंपनी अपनी कुल संपत्तियों पर 20% रिटर्न कमा रही है।
ROA वित्तीय दक्षता का एक महत्वपूर्ण मापदंड है, और उच्च ROA आमतौर पर इंगित करता है:
हालांकि, कम ROA यह संकेत कर सकता है कि कंपनी अपनी संपत्तियों का सही उपयोग नहीं कर रही है या संचालन में अक्षम है।
ROA अलग-अलग उद्योगों में भिन्न होता है। नीचे एक तुलना दी गई है:
| उद्योग | कंपनी | शुद्ध आय (₹ करोड़) | कुल संपत्तियाँ (₹ करोड़) | ROA (%) |
|---|---|---|---|---|
| खुदरा | कंपनी X | ₹5 करोड़ | ₹50 करोड़ | 10% |
| ऑटोमोबाइल | कंपनी Y | ₹15 करोड़ | ₹75 करोड़ | 20% |
| प्रौद्योगिकी | कंपनी Z | ₹12 करोड़ | ₹60 करोड़ | 20% |
विभिन्न उद्योगों में ROA की तुलना करके निवेशक यह समझ सकते हैं कि कौन सी कंपनियां अपनी संपत्तियों का सबसे अच्छा उपयोग कर रही हैं और उच्चतम लाभ उत्पन्न कर रही हैं।
तरलता अनुपात किसी कंपनी की अपनी वर्तमान संपत्तियों का उपयोग करके अल्पकालिक देनदारियों को पूरा करने की क्षमता को मापते हैं।
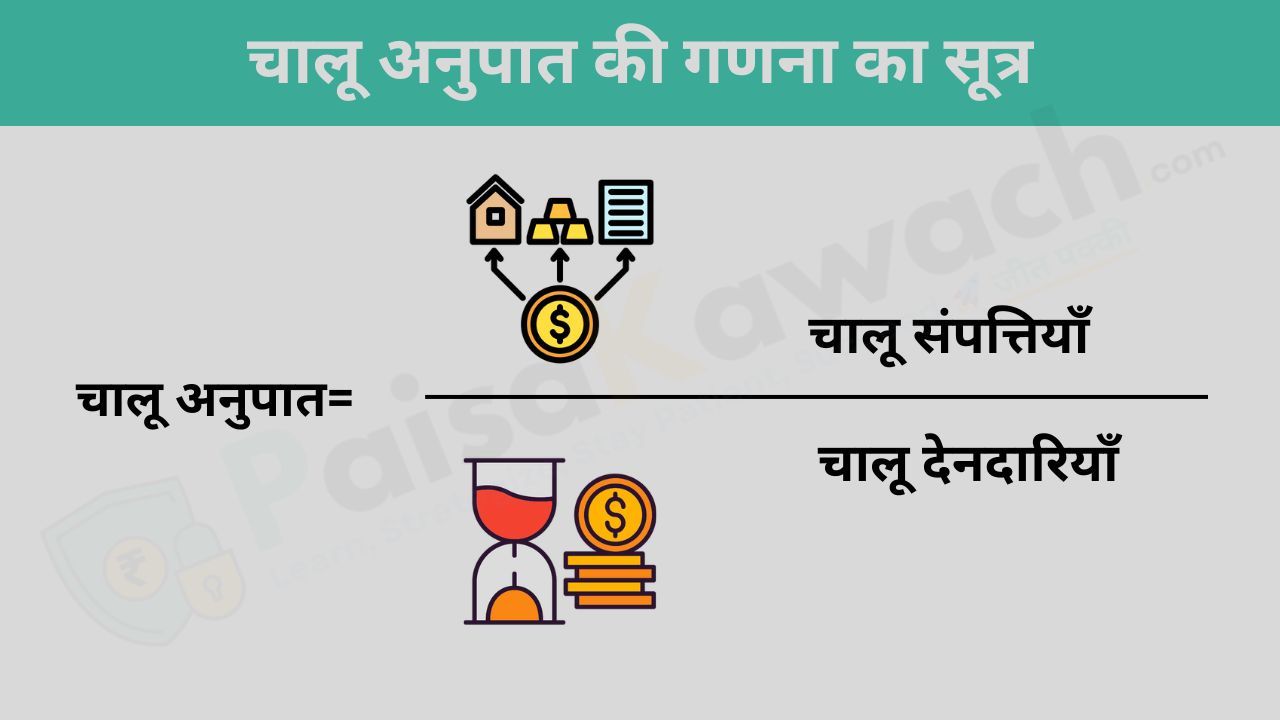
चालू अनुपात (Current Ratio) एक महत्वपूर्ण तरलता अनुपात है जो यह आकलन करता है कि कोई कंपनी अपनी अल्पकालिक देनदारियों को अपनी अल्पकालिक संपत्तियों से कितनी कुशलता से पूरा कर सकती है। यह दर्शाता है कि कंपनी के पास अपनी वर्तमान वित्तीय प्रतिबद्धताओं को पूरा करने के लिए पर्याप्त संपत्तियाँ हैं या नहीं।
चालू अनुपात की गणना निम्नलिखित सूत्र से की जाती है:
चालू अनुपात = चालू संपत्तियाँ ÷ चालू देनदारियाँउदाहरण के लिए, यदि किसी कंपनी की चालू संपत्तियाँ ₹50 करोड़ और चालू देनदारियाँ ₹25 करोड़ हैं, तो उसका चालू अनुपात होगा:
चालू अनुपात = 50 ÷ 25 = 2.0इसका मतलब है कि कंपनी के पास अपनी अल्पकालिक देनदारियों को पूरा करने के लिए दोगुनी संपत्ति उपलब्ध है, जो अच्छी तरलता की स्थिति को दर्शाता है।
चालू अनुपात किसी कंपनी की वित्तीय स्थिरता का महत्वपूर्ण संकेतक है। उच्च चालू अनुपात आमतौर पर इंगित करता है:
हालांकि, बहुत अधिक चालू अनुपात (जैसे 3.0 से ऊपर) यह संकेत कर सकता है कि कंपनी अपनी संपत्तियों का प्रभावी उपयोग नहीं कर रही है, जबकि कम चालू अनुपात (1.0 से नीचे) तरलता की समस्याओं का संकेत देता है।
अलग-अलग उद्योगों में चालू अनुपात अलग-अलग होता है। नीचे एक तुलना दी गई है:
| उद्योग | कंपनी | चालू संपत्तियाँ (₹ करोड़) | चालू देनदारियाँ (₹ करोड़) | चालू अनुपात |
|---|---|---|---|---|
| खुदरा | कंपनी A | ₹30 करोड़ | ₹20 करोड़ | 1.5 |
| उत्पादन | कंपनी B | ₹100 करोड़ | ₹50 करोड़ | 2.0 |
| फार्मास्युटिकल | कंपनी C | ₹60 करोड़ | ₹30 करोड़ | 2.0 |
इसी उद्योग में कंपनियों के चालू अनुपात की तुलना करके निवेशक यह समझ सकते हैं कि कौन सी कंपनियाँ अल्पकालिक वित्तीय स्थिरता और जोखिम प्रबंधन में बेहतर प्रदर्शन कर रही हैं।
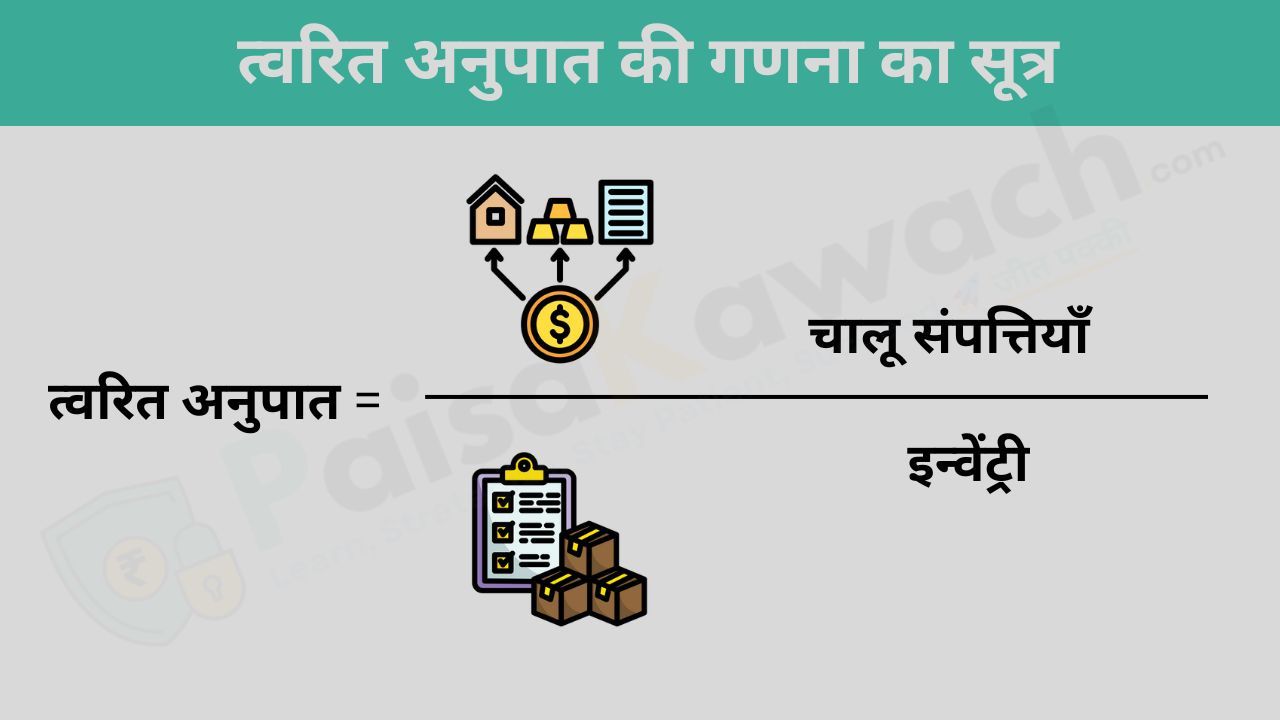
त्वरित अनुपात (Quick Ratio), जिसे Acid-Test Ratio भी कहा जाता है, चालू अनुपात (Current Ratio) की तुलना में अधिक सख्त तरलता मापदंड है। यह कंपनी की अल्पकालिक वित्तीय स्थिति को केवल सबसे तरल संपत्तियों के आधार पर आकलित करता है, जबकि इन्वेंट्री को बाहर रखता है।
चूंकि इन्वेंट्री को बेचने में समय लग सकता है, त्वरित अनुपात कंपनी की तत्काल वित्तीय ताकत को अधिक यथार्थवादी तरीके से दर्शाता है।
त्वरित अनुपात निम्नलिखित सूत्र से गणना किया जाता है:
त्वरित अनुपात = (चालू संपत्तियाँ - इन्वेंट्री) ÷ चालू देनदारियाँउदाहरण के लिए, यदि किसी कंपनी के पास:
तो त्वरित अनुपात होगा:
त्वरित अनुपात = (50 - 20) ÷ 25 = 1.2इसका मतलब है कि कंपनी के पास प्रत्येक ₹1 की अल्पकालिक देनदारी के लिए ₹1.20 की उच्च तरल संपत्ति उपलब्ध है।
त्वरित अनुपात एक महत्वपूर्ण वित्तीय संकेतक है क्योंकि यह:
1.0 से ऊपर का त्वरित अनुपात आमतौर पर मजबूत तरलता को दर्शाता है, जबकि 1.0 से नीचे का अनुपात संभावित वित्तीय कठिनाइयों का संकेत दे सकता है।
अलग-अलग उद्योगों में त्वरित अनुपात अलग-अलग होता है। नीचे एक तुलना दी गई है:
| उद्योग | कंपनी | चालू संपत्तियाँ (₹ करोड़) | इन्वेंट्री (₹ करोड़) | चालू देनदारियाँ (₹ करोड़) | त्वरित अनुपात |
|---|---|---|---|---|---|
| खुदरा | कंपनी A | ₹30 करोड़ | ₹10 करोड़ | ₹20 करोड़ | 1.0 |
| उत्पादन | कंपनी B | ₹100 करोड़ | ₹50 करोड़ | ₹50 करोड़ | 1.0 |
इस अनुपात का उपयोग निवेशक यह आकलन करने के लिए करते हैं कि किसी कंपनी की तरलता कितनी मजबूत है।
ये अनुपात किसी कंपनी की दीर्घकालिक वित्तीय स्थिरता और ऋण दायित्वों को पूरा करने की क्षमता को इंगित करते हैं।
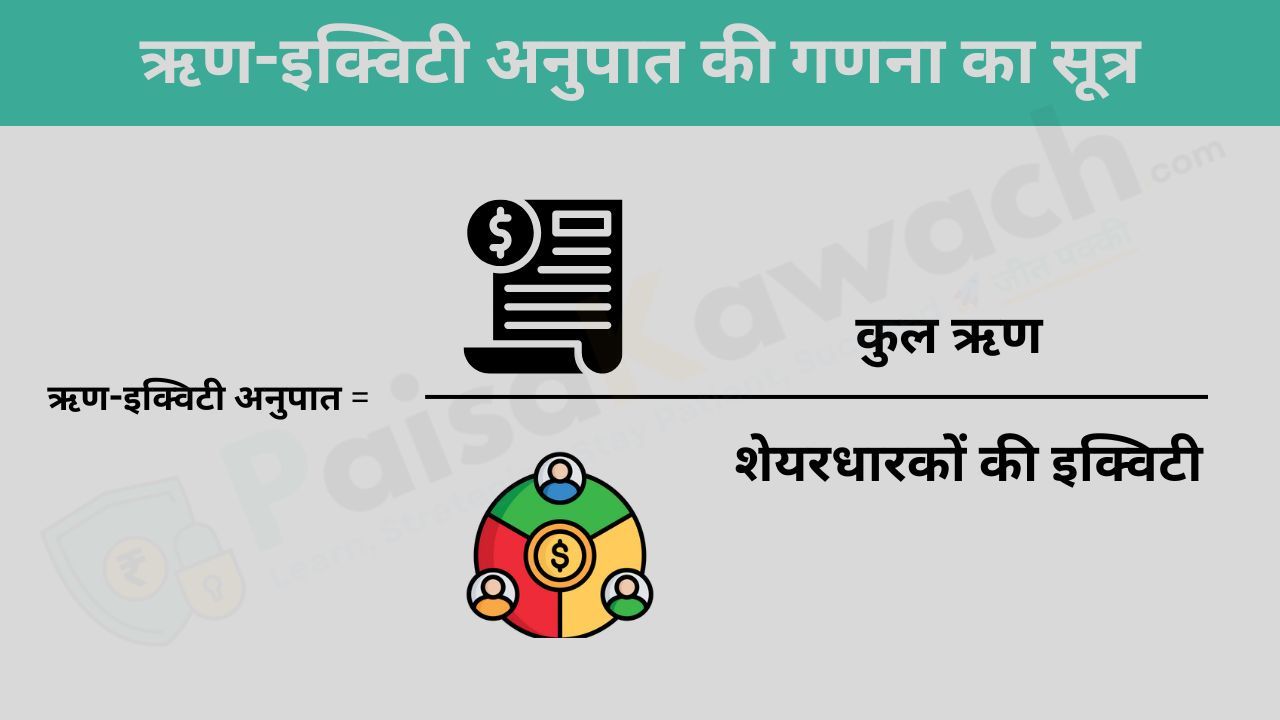
ऋण-इक्विटी (D/E) अनुपात एक महत्वपूर्ण वित्तीय मीट्रिक है जो किसी कंपनी के वित्तीय उत्तोलन को मापता है, यह दर्शाता है कि कंपनी की कुल देनदारियां उसके शेयरधारकों की इक्विटी की तुलना में कितनी अधिक हैं।
यह अनुपात निवेशकों और विश्लेषकों को यह समझने में मदद करता है कि कोई कंपनी अपने परिचालन को वित्तपोषित करने के लिए उधार लिए गए धन पर कितना निर्भर है बनाम अपनी पूंजी का उपयोग कर रही है। उच्च D/E अनुपात इंगित करता है कि कंपनी भारी ऋण वित्तपोषण पर निर्भर है, जो वित्तीय जोखिम को बढ़ा सकता है।
इस अनुपात की गणना निम्नलिखित सूत्र से की जाती है:
ऋण-इक्विटी अनुपात = कुल ऋण ÷ शेयरधारकों की इक्विटीउदाहरण के लिए, यदि किसी कंपनी के पास:
तो ऋण-इक्विटी अनुपात होगा:
D/E अनुपात = 100 ÷ 200 = 0.5इसका अर्थ है कि कंपनी के पास ₹1 के इक्विटी पर ₹0.50 ऋण है।
किसी कंपनी का D/E अनुपात वित्तीय जोखिम को समझने में मदद करता है। एक कम D/E अनुपात आमतौर पर इंगित करता है:
हालांकि, एक अत्यधिक कम D/E अनुपात यह भी संकेत दे सकता है कि कंपनी विस्तार के लिए पर्याप्त ऋण का उपयोग नहीं कर रही है।
विभिन्न उद्योगों में स्वीकार्य D/E अनुपात अलग-अलग हो सकते हैं। नीचे एक तुलना दी गई है:
| उद्योग | कंपनी | कुल ऋण (₹ करोड़) | शेयरधारकों की इक्विटी (₹ करोड़) | D/E अनुपात |
|---|---|---|---|---|
| प्रौद्योगिकी | कंपनी A | ₹50 करोड़ | ₹200 करोड़ | 0.25 |
| बैंकिंग | कंपनी B | ₹300 करोड़ | ₹250 करोड़ | 1.2 |
| निर्माण | कंपनी C | ₹100 करोड़ | ₹150 करोड़ | 0.67 |
निवेशक इस अनुपात का उपयोग उद्योग में विभिन्न कंपनियों के वित्तीय जोखिम की तुलना करने के लिए करते हैं।
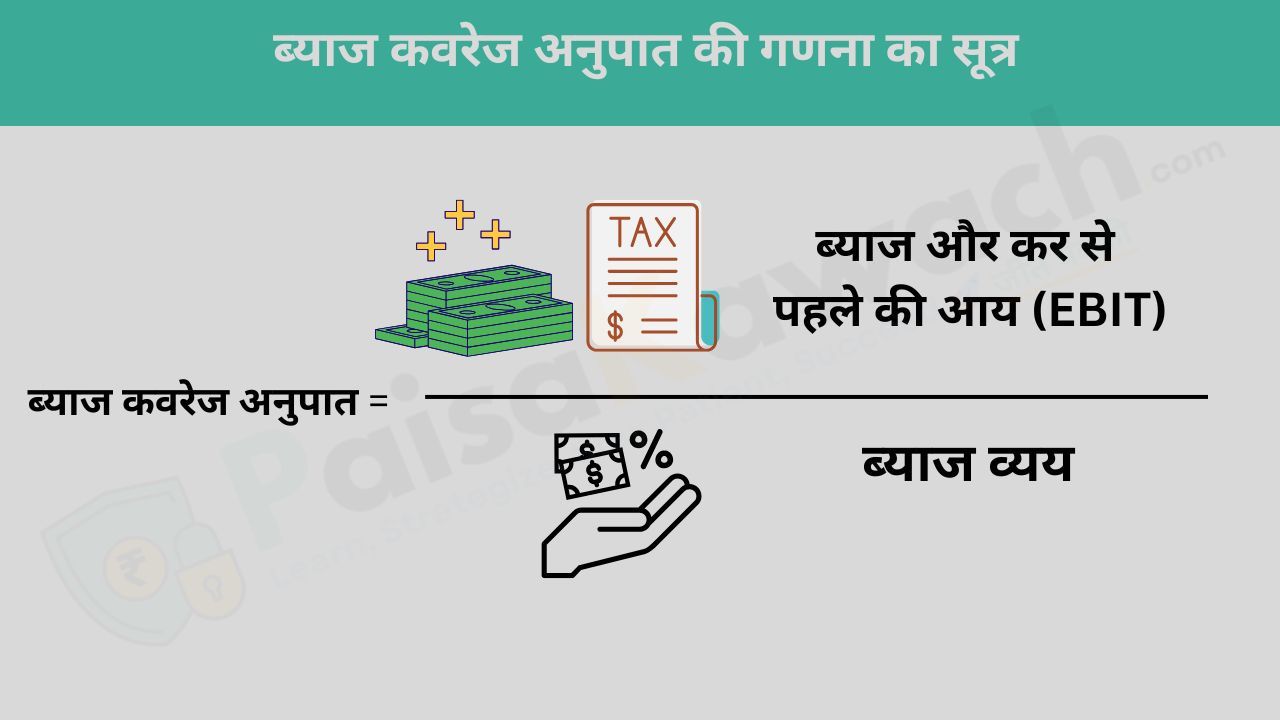
ब्याज कवरेज अनुपात एक महत्वपूर्ण वित्तीय मीट्रिक है जो यह मापता है कि किसी कंपनी के लिए अपनी ब्याज देनदारियों का भुगतान करना कितना आसान है।
यह अनुपात दर्शाता है कि कोई कंपनी अपने ऋण पर ब्याज चुकाने के लिए कितनी कुशलता से अपनी कमाई का उपयोग कर रही है। उच्च ब्याज कवरेज अनुपात इंगित करता है कि कंपनी के पास ब्याज चुकाने के लिए पर्याप्त कमाई है, जबकि कम अनुपात वित्तीय संकट का संकेत दे सकता है।
इस अनुपात की गणना निम्नलिखित सूत्र से की जाती है:
ब्याज कवरेज अनुपात = ब्याज और कर से पहले की आय (EBIT) ÷ ब्याज व्ययउदाहरण के लिए, यदि किसी कंपनी के पास:
तो ब्याज कवरेज अनुपात होगा:
ब्याज कवरेज अनुपात = 50 ÷ 10 = 5इसका अर्थ है कि कंपनी की आय ब्याज भुगतान की राशि से 5 गुना अधिक है।
ब्याज कवरेज अनुपात वित्तीय स्थिरता को मापने का एक प्रमुख संकेतक है। उच्च अनुपात आमतौर पर इंगित करता है:
हालांकि, एक अत्यधिक उच्च अनुपात यह भी दर्शा सकता है कि कंपनी ऋण का उपयोग उतना प्रभावी ढंग से नहीं कर रही है।
विभिन्न उद्योगों में स्वीकृत ब्याज कवरेज अनुपात अलग-अलग हो सकते हैं। नीचे एक तुलना दी गई है:
| उद्योग | कंपनी | EBIT (₹ करोड़) | ब्याज व्यय (₹ करोड़) | ब्याज कवरेज अनुपात |
|---|---|---|---|---|
| प्रौद्योगिकी | कंपनी A | ₹100 करोड़ | ₹10 करोड़ | 10 |
| बैंकिंग | कंपनी B | ₹150 करोड़ | ₹50 करोड़ | 3 |
| निर्माण | कंपनी C | ₹80 करोड़ | ₹20 करोड़ | 4 |
निवेशक और ऋणदाता इस अनुपात का विश्लेषण करते हैं ताकि यह समझ सकें कि कंपनी अपने ऋण दायित्वों को कितनी आसानी से पूरा कर सकती है।
दक्षता अनुपात यह विश्लेषण करते हैं कि कोई कंपनी अपनी संपत्तियों और देनदारियों का उपयोग कितनी प्रभावी रूप से राजस्व उत्पन्न करने के लिए कर रही है।
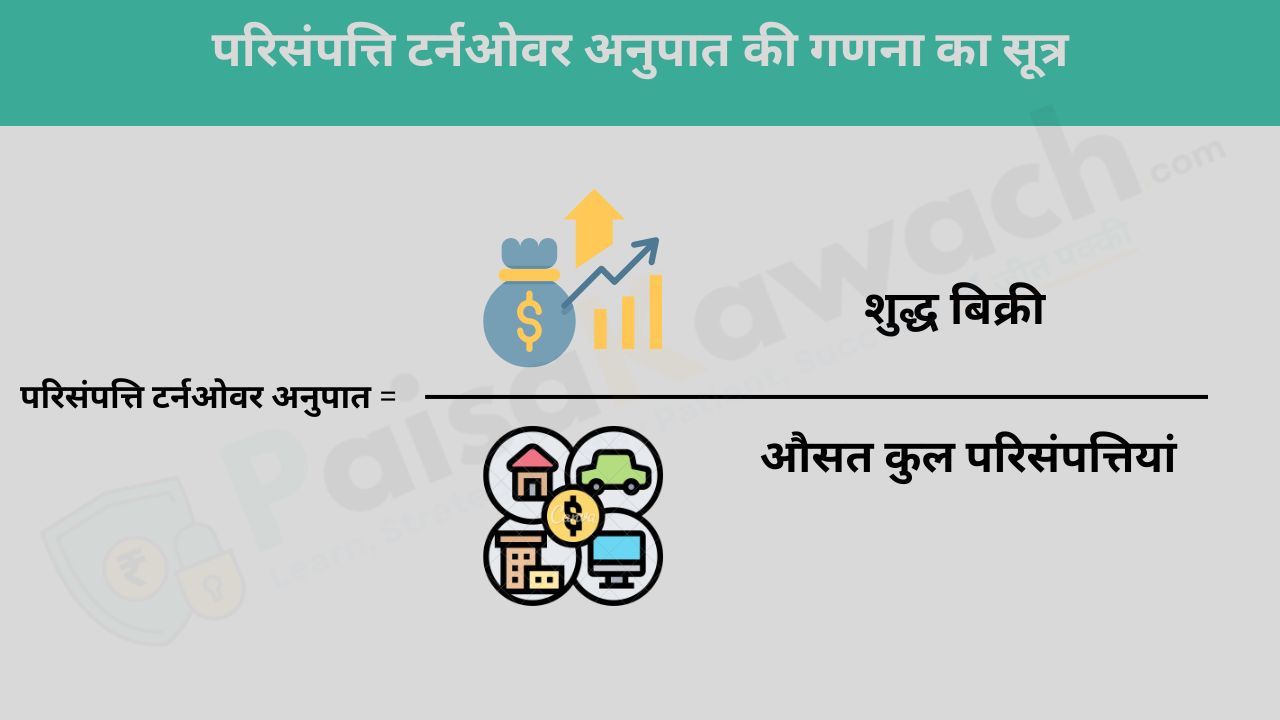
परिसंपत्ति टर्नओवर अनुपात एक महत्वपूर्ण वित्तीय मीट्रिक है जो यह मापता है कि कोई कंपनी अपनी परिसंपत्तियों का उपयोग करके राजस्व उत्पन्न करने में कितनी कुशल है।
यह दर्शाता है कि किसी निश्चित अवधि में कंपनी की कुल परिसंपत्तियों को कितनी बार बिक्री में परिवर्तित किया गया। एक उच्च परिसंपत्ति टर्नओवर अनुपात दर्शाता है कि कंपनी अपनी परिसंपत्तियों का कुशलतापूर्वक उपयोग कर रही है, जबकि कम अनुपात संचालन में अक्षमता या परिसंपत्तियों का कम उपयोग इंगित कर सकता है।
इस अनुपात की गणना निम्नलिखित सूत्र से की जाती है:
परिसंपत्ति टर्नओवर अनुपात = शुद्ध बिक्री ÷ औसत कुल परिसंपत्तियांउदाहरण के लिए, यदि किसी कंपनी के पास:
तो परिसंपत्ति टर्नओवर अनुपात होगा:
परिसंपत्ति टर्नओवर अनुपात = 200 ÷ 100 = 2इसका अर्थ है कि कंपनी प्रत्येक ₹1 की परिसंपत्तियों पर ₹2 की बिक्री उत्पन्न कर रही है।
परिसंपत्ति टर्नओवर अनुपात संचालन की दक्षता का एक महत्वपूर्ण संकेतक है। उच्च अनुपात आमतौर पर इंगित करता है:
हालांकि, एक अत्यधिक उच्च अनुपात यह भी दर्शा सकता है कि कंपनी दीर्घकालिक परिसंपत्तियों में पर्याप्त निवेश नहीं कर रही है, जो भविष्य की वृद्धि को सीमित कर सकता है।
विभिन्न उद्योगों में परिसंपत्ति टर्नओवर अनुपात के मानक अलग-अलग होते हैं। नीचे एक तुलना दी गई है:
| उद्योग | कंपनी | शुद्ध बिक्री (₹ करोड़) | औसत कुल परिसंपत्तियां (₹ करोड़) | परिसंपत्ति टर्नओवर अनुपात |
|---|---|---|---|---|
| खुदरा | कंपनी A | ₹500 करोड़ | ₹200 करोड़ | 2.5 |
| निर्माण | कंपनी B | ₹300 करोड़ | ₹150 करोड़ | 2.0 |
| टेलीकॉम | कंपनी C | ₹200 करोड़ | ₹300 करोड़ | 0.67 |
इसी उद्योग के भीतर परिसंपत्ति टर्नओवर अनुपात की तुलना करने से निवेशकों को यह समझने में मदद मिलती है कि कोई कंपनी प्रतिस्पर्धियों की तुलना में अपनी परिसंपत्तियों का कितना कुशलतापूर्वक उपयोग कर रही है।
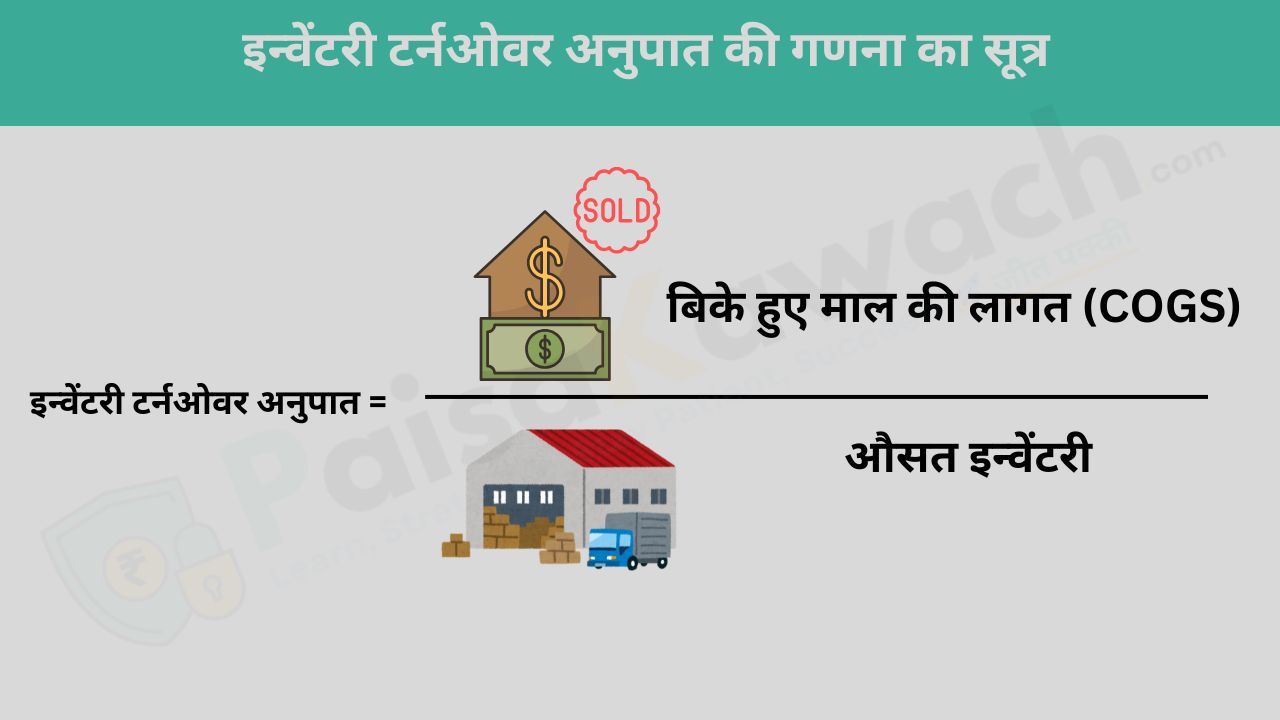
इन्वेंटरी टर्नओवर अनुपात एक महत्वपूर्ण वित्तीय मीट्रिक है जो यह मापता है कि कोई कंपनी अपनी इन्वेंटरी का प्रबंधन कितनी कुशलता से कर रही है, यह दर्शाते हुए कि एक निश्चित अवधि में सामान कितनी तेजी से बेचा और बदला जाता है।
एक उच्च इन्वेंटरी टर्नओवर अनुपात मजबूत बिक्री और प्रभावी इन्वेंटरी प्रबंधन को दर्शाता है, जबकि एक कम अनुपात ओवरस्टॉकिंग, धीमी बिक्री, या मांग की गलत भविष्यवाणी को इंगित कर सकता है।
इस अनुपात की गणना निम्नलिखित सूत्र से की जाती है:
इन्वेंटरी टर्नओवर अनुपात = बिके हुए माल की लागत (COGS) ÷ औसत इन्वेंटरीउदाहरण के लिए, यदि किसी कंपनी के पास:
तो इन्वेंटरी टर्नओवर अनुपात होगा:
इन्वेंटरी टर्नओवर अनुपात = 500 ÷ 100 = 5इसका अर्थ है कि कंपनी अपनी पूरी इन्वेंटरी को 5 बार एक वर्ष में बेच और बदल रही है।
इन्वेंटरी टर्नओवर अनुपात व्यवसायों को स्टॉक स्तरों को अनुकूलित करने और लाभप्रदता बढ़ाने में मदद करता है। एक उच्च अनुपात आमतौर पर दर्शाता है:
हालांकि, एक अत्यधिक उच्च अनुपात बार-बार स्टॉक की कमी को इंगित कर सकता है, जिससे बिक्री के अवसर छूट सकते हैं।
विभिन्न उद्योगों में इन्वेंटरी टर्नओवर अनुपात के मानक अलग-अलग होते हैं। नीचे एक तुलना दी गई है:
| उद्योग | कंपनी | COGS (₹ करोड़) | औसत इन्वेंटरी (₹ करोड़) | इन्वेंटरी टर्नओवर अनुपात |
|---|---|---|---|---|
| खुदरा | कंपनी A | ₹600 करोड़ | ₹100 करोड़ | 6 |
| निर्माण | कंपनी B | ₹400 करोड़ | ₹150 करोड़ | 2.67 |
| फार्मास्यूटिकल | कंपनी C | ₹300 करोड़ | ₹75 करोड़ | 4 |
इसी उद्योग के भीतर इन्वेंटरी टर्नओवर अनुपात की तुलना करने से कंपनियों की इन्वेंटरी दक्षता को समझने में मदद मिलती है।
इन वित्तीय अनुपातों का विश्लेषण करके, निवेशक समान उद्योग में कंपनियों के बीच डेटा-संचालित तुलना कर सकते हैं, वित्तीय ताकत और कमजोरियों का आकलन कर सकते हैं, और सूचित निवेश निर्णय ले सकते हैं।
Imagine you're about to invest your hard-earned money. Would you rather pick a stock randomly or make a well-informed decision? This is where sector analysis comes into play. It’s a powerful tool that helps investors understand how different industries function, evolve, and respond to market forces. Whether you're a beginner or a seasoned investor, analyzing sectors gives you a broader perspective on where opportunities lie and which industries might struggle in the near future.
Sector analysis is the process of evaluating the performance and future potential of a specific industry. Instead of focusing on individual companies, it looks at the broader trends that affect multiple businesses within the same sector. By understanding these patterns, investors can make informed decisions on whether a particular industry is worth investing in.
Every industry operates within a larger economic framework, meaning several external and internal factors can impact its growth. Understanding these factors is essential for predicting how a sector will perform.

Every industry operates within a broader economic environment. Just like the weather affects farming, macroeconomic conditions influence how different sectors perform. Understanding these conditions can help investors predict market movements, identify growth opportunities, and avoid risky investments.
Macroeconomic conditions refer to the overall state of an economy and the key factors that drive its growth, stability, or decline. These conditions are influenced by government policies, central banks, global trade, and consumer behavior. They act as the foundation upon which all businesses operate, making them a crucial consideration for investors.
Interest rates, set by central banks like the Federal Reserve (USA), RBI (India), or ECB (Europe), determine how expensive or cheap it is to borrow money. A small shift in interest rates can ripple through the entire economy, affecting businesses, consumers, and investors.
Inflation measures the rate at which prices for goods and services rise. While moderate inflation signals a healthy economy, excessive inflation can erode purchasing power and disrupt market stability.
Gross Domestic Product (GDP) measures the total economic output of a country. It serves as an indicator of economic health and sector performance.
Macroeconomic conditions do not operate in isolation—they influence each other. For example:
Smart investors pay close attention to macroeconomic trends because they directly impact sector performance. By understanding these factors, investors can:

The stock market and industries do not move in a straight line—they rise and fall in cycles. Sometimes, the economy is booming, and at other times, it slows down. These fluctuations are called market cycles. Investors who understand these cycles can strategically time their investments and maximize profits.
A market cycle refers to the repeated pattern of economic expansion (growth), peak (highest point), recession (decline), and recovery. Different industries react differently to each stage. Some sectors thrive when the economy is growing, while others remain stable or even perform better during downturns. For example, during a booming economy, luxury brands, real estate, and technology sectors do well. However, during a recession, healthcare, consumer staples, and utility sectors become safer investment options.
This is when the economy is thriving—GDP is growing, unemployment is low, and consumer spending is high. Interest rates are usually low, making borrowing cheap. Businesses expand, wages increase, and stock markets rally.
The peak phase is when the economy reaches its highest point. Inflation starts rising, central banks may increase interest rates to control excessive growth, and stock prices may become overvalued.
During a recession, GDP declines, businesses struggle, and unemployment rises. Consumer spending drops, and stock prices fall.
In the recovery phase, the economy begins to regain strength. Business activity increases, consumer confidence returns, and stock markets start to recover.
Smart investors always analyze market cycles to make informed investment decisions. Understanding which sectors perform well in different phases helps them:

Regulatory changes refer to modifications in laws, government policies, taxation, and industry-specific rules that impact businesses and entire sectors. These changes can be game-changers—either creating new growth opportunities or imposing restrictions that challenge an industry's survival.
Governments worldwide regulate industries to maintain economic stability, protect consumers, and promote fair competition. These regulations evolve based on technological advancements, market failures, environmental concerns, and global trends. For businesses and investors, staying ahead of regulatory shifts is crucial. A favorable policy can boost an industry's profitability, while a sudden tax hike or ban can cause massive losses.
Changes in corporate taxes, import/export duties, and industry-specific levies directly impact profitability. - Corporate Tax Cuts: Lower taxes mean more profits for businesses, encouraging investment and expansion. - Tax Increases: Higher taxes reduce company earnings and may lead to price hikes for consumers. - Subsidies & Tax Breaks: Governments often provide incentives to promote sectors like renewable energy and electric vehicles.
With growing concerns about climate change, governments impose environmental laws such as carbon emission limits, plastic bans, and green energy mandates. Companies that fail to comply may face heavy fines or operational restrictions.
Governments impose tariffs (taxes on imports/exports) to protect local industries or retaliate in trade wars. - Higher Tariffs on Imports: Help domestic manufacturers but increase costs for consumers. - Free Trade Agreements (FTAs): Boost cross-border business by reducing duties and easing regulations.
Some industries have strict laws governing their operations. - Banking & Finance: Central banks regulate interest rates, lending policies, and capital reserves. - Healthcare & Pharmaceuticals: Drug approval processes and price controls affect profitability. - Technology & Data Protection: Laws like GDPR dictate how companies handle user data.
- Stay Informed: Regularly track policy changes that affect investments. - Diversify Investments: Reduce risk by spreading investments across multiple sectors. - Look for Opportunities: Industries benefiting from regulations can be great long-term bets.

Technology is constantly evolving, reshaping industries, disrupting traditional businesses, and unlocking new opportunities. From artificial intelligence and automation to biotechnology and blockchain, technological innovations redefine how businesses operate, how consumers interact with products, and how investors spot emerging trends.
In today’s fast-paced world, businesses that fail to adapt to new technologies risk falling behind. Emerging technologies can improve efficiency, reduce costs, and create entirely new markets. However, they can also make existing business models obsolete, forcing industries to either innovate or perish.
AI-powered automation is transforming industries by replacing repetitive tasks with smart algorithms. - AI in Finance: Robo-advisors and AI-driven analytics are improving investment decisions. - Automation in Manufacturing: Robots are increasing efficiency and reducing labor costs. - AI in Healthcare: Machine learning models help diagnose diseases faster and more accurately.
Blockchain is revolutionizing data security, payments, and decentralized finance. - Cryptocurrencies: Digital assets like Bitcoin and Ethereum challenge traditional financial systems. - Smart Contracts: Automate legal agreements without intermediaries. - Supply Chain Transparency: Companies track products securely from production to delivery.
As the world shifts toward sustainability, green technologies are gaining momentum. - Solar & Wind Energy: Clean energy sources reduce dependence on fossil fuels. - Electric Vehicles (EVs): Companies like Tesla and BYD are leading the EV revolution. - Smart Grids: AI-driven power distribution optimizes energy consumption.
- Identify Emerging Trends: Keep an eye on breakthrough technologies shaping the future. - Diversify Investments: Invest in tech-driven companies while hedging risks in traditional sectors. - Stay Adaptable: Businesses that evolve with technology tend to outperform stagnant competitors.

Consumer trends play a crucial role in shaping the success or failure of industries. As people’s preferences evolve, businesses must adapt or risk becoming irrelevant. Whether it’s the growing demand for electric vehicles (EVs), the shift toward sustainable products, or the rise of digital services, consumer behavior directly influences sector demand.
Consumers are the backbone of every industry. Their spending habits, lifestyle choices, and values dictate market trends. Companies that anticipate and respond to these shifts gain a competitive advantage, while those that fail to adapt often struggle to survive.
As environmental awareness increases, consumers are moving away from gasoline-powered vehicles. - EV Popularity: Brands like Tesla, BYD, and Rivian are leading the charge in the EV market. - Government Support: Incentives and stricter emissions regulations are driving EV adoption. - Battery Innovation: Advances in battery technology are making EVs more affordable and efficient.
Consumers are prioritizing sustainability, leading to a surge in demand for eco-friendly products. - Green Packaging: Brands are switching to biodegradable and recyclable materials. - Organic & Plant-Based Foods: The rise of plant-based diets is transforming the food industry. - Ethical Consumerism: People prefer brands that support fair trade and ethical sourcing.
The digital revolution is changing the way people shop, work, and entertain themselves. - Online Shopping Boom: E-commerce giants like Amazon, Flipkart, and Alibaba dominate retail. - Streaming Services: Platforms like Netflix, Disney+, and YouTube are replacing traditional TV. - Remote Work Culture: More businesses are shifting to hybrid or fully remote models.
- Follow Consumer Behavior: Identify trends early and invest in companies that align with changing preferences. - Diversify Investments: Balance traditional sectors with emerging consumer-driven markets. - Adapt to Market Shifts: Companies that stay ahead of consumer trends tend to outperform competitors.
Investing without sector analysis is like driving without a roadmap—you might get lucky, but chances are you’ll end up lost. By analyzing sectors, investors can:
By understanding these factors, investors can identify sectors that are likely to grow or decline, helping them make informed investment decisions. This analysis also plays a key role in diversification strategies, reducing risks associated with investing in a single industry.

कल्पना करें कि आप अपनी मेहनत की कमाई निवेश करना चाहते हैं। क्या आप किसी भी स्टॉक को बिना सोचे-समझे चुनेंगे, या फिर एक सूचित निर्णय लेंगे? यहीं पर सेक्टर विश्लेषण मददगार साबित होता है। यह एक शक्तिशाली तरीका है जो निवेशकों को यह समझने में मदद करता है कि विभिन्न उद्योग कैसे काम करते हैं, विकसित होते हैं, और बाजार की ताकतों का जवाब देते हैं। चाहे आप एक शुरुआती निवेशक हों या अनुभवी, सेक्टर विश्लेषण आपको यह समझने में मदद करता है कि कहां संभावनाएं हैं और किन उद्योगों को निकट भविष्य में संघर्ष करना पड़ सकता है।
सेक्टर विश्लेषण किसी विशेष उद्योग के प्रदर्शन और भविष्य की संभावनाओं का मूल्यांकन करने की प्रक्रिया है। यह व्यक्तिगत कंपनियों पर ध्यान केंद्रित करने के बजाय व्यापक रुझानों को देखता है जो एक ही क्षेत्र की कई कंपनियों को प्रभावित करते हैं। इन पैटर्न को समझकर, निवेशक बेहतर निर्णय ले सकते हैं कि कोई उद्योग निवेश के योग्य है या नहीं।
प्रत्येक उद्योग एक बड़े आर्थिक ढांचे के भीतर कार्य करता है, जिसका अर्थ है कि कई बाहरी और आंतरिक कारक इसके विकास को प्रभावित कर सकते हैं। इन कारकों को समझना आवश्यक है ताकि यह अनुमान लगाया जा सके कि कोई क्षेत्र कैसा प्रदर्शन करेगा।
हर उद्योग एक बड़े आर्थिक वातावरण में संचालित होता है। जिस तरह मौसम खेती को प्रभावित करता है, उसी तरह व्यापक आर्थिक परिस्थितियाँ विभिन्न क्षेत्रों के प्रदर्शन को प्रभावित करती हैं। इन स्थितियों को समझकर निवेशक बाजार की गतिविधियों का अनुमान लगा सकते हैं, विकास के अवसरों की पहचान कर सकते हैं और जोखिम भरे निवेशों से बच सकते हैं।
व्यापक आर्थिक परिस्थितियाँ किसी देश की अर्थव्यवस्था की समग्र स्थिति को दर्शाती हैं। ये कारक सरकार की नीतियों, केंद्रीय बैंकों, वैश्विक व्यापार और उपभोक्ता व्यवहार से प्रभावित होते हैं। ये किसी भी व्यावसायिक क्षेत्र के लिए नींव का काम करती हैं, जिससे निवेशकों के लिए इनका विश्लेषण करना अत्यंत महत्वपूर्ण हो जाता है।
ब्याज दरें केंद्रीय बैंकों जैसे कि फेडरल रिजर्व (अमेरिका), आरबीआई (भारत) या ईसीबी (यूरोप) द्वारा निर्धारित की जाती हैं। ये तय करती हैं कि पैसे उधार लेना सस्ता होगा या महंगा। ब्याज दरों में छोटे बदलाव भी पूरे आर्थिक तंत्र को प्रभावित कर सकते हैं।
मुद्रास्फीति उस दर को मापती है जिससे वस्तुओं और सेवाओं की कीमतें बढ़ती हैं। मध्यम स्तर की मुद्रास्फीति स्वस्थ अर्थव्यवस्था का संकेत देती है, लेकिन अत्यधिक मुद्रास्फीति क्रय शक्ति (Purchasing Power) को कमजोर कर सकती है और बाजार की स्थिरता को प्रभावित कर सकती है।
सकल घरेलू उत्पाद (GDP) किसी देश के कुल आर्थिक उत्पादन को मापता है। यह आर्थिक स्वास्थ्य और विभिन्न क्षेत्रों के प्रदर्शन का प्रमुख संकेतक होता है।
व्यापक आर्थिक परिस्थितियाँ अलग-अलग काम नहीं करतीं—ये एक-दूसरे को प्रभावित करती हैं। उदाहरण के लिए:
समझदार निवेशक व्यापक आर्थिक रुझानों पर करीबी नजर रखते हैं क्योंकि ये सीधे तौर पर सेक्टर प्रदर्शन को प्रभावित करते हैं। इन कारकों को समझकर निवेशक:
शेयर बाजार और उद्योग हमेशा एक सीधी रेखा में नहीं चलते—ये समय-समय पर ऊपर-नीचे होते हैं। कभी अर्थव्यवस्था उछाल मारती है, तो कभी मंदी आ जाती है। इस उतार-चढ़ाव को बाजार चक्र कहा जाता है। जो निवेशक इन चक्रों को समझते हैं, वे सही समय पर सही क्षेत्र में निवेश करके अधिक लाभ कमा सकते हैं।
बाजार चक्र एक दोहराने वाला पैटर्न है जिसमें अर्थव्यवस्था विस्तार (वृद्धि), चरम (सबसे ऊँचा बिंदु), मंदी (गिरावट), और पुनर्प्राप्ति (सुधार) के चरणों से गुजरती है। हर उद्योग इन चरणों पर अलग-अलग प्रतिक्रिया देता है। कुछ सेक्टर अर्थव्यवस्था की वृद्धि के दौरान अच्छा करते हैं, जबकि कुछ मंदी के दौरान स्थिर रहते हैं। उदाहरण के लिए, जब अर्थव्यवस्था तेजी से बढ़ती है, तो लक्ज़री ब्रांड, रियल एस्टेट और टेक्नोलॉजी सेक्टर अच्छा प्रदर्शन करते हैं। वहीं, मंदी के दौरान स्वास्थ्य सेवा, एफएमसीजी और यूटिलिटी सेक्टर सुरक्षित निवेश साबित होते हैं।
यह वह समय होता है जब अर्थव्यवस्था फल-फूल रही होती है—GDP बढ़ता है, बेरोजगारी कम होती है, और उपभोक्ता खर्च अधिक होता है। ब्याज दरें कम होती हैं, जिससे व्यापार का विस्तार होता है और शेयर बाजार ऊपर जाता है।
चरम चरण वह होता है जब अर्थव्यवस्था अपनी अधिकतम ऊँचाई पर पहुँच जाती है। मुद्रास्फीति बढ़ने लगती है, केंद्रीय बैंक ब्याज दरें बढ़ाकर नियंत्रण करने की कोशिश करते हैं, और शेयर बाजार में अस्थिरता आ सकती है।
मंदी के दौरान GDP घटता है, कंपनियाँ संघर्ष करती हैं, और बेरोजगारी बढ़ती है। उपभोक्ता खर्च में कमी आती है, और शेयर बाजार गिरता है।
पुनर्प्राप्ति के दौरान अर्थव्यवस्था फिर से मजबूत होने लगती है। व्यापार गतिविधियाँ बढ़ती हैं, उपभोक्ता विश्वास लौटता है, और शेयर बाजार ऊपर जाने लगता है।
नियामक परिवर्तन वे सरकारी नीतियाँ, कर कानून, और उद्योग-विशेष नियम होते हैं जो व्यापारों और पूरे सेक्टर को प्रभावित करते हैं। ये बदलाव किसी उद्योग के लिए वरदान भी साबित हो सकते हैं और कभी-कभी गंभीर चुनौतियाँ भी पैदा कर सकते हैं।
सरकारें उद्योगों को नियंत्रित करती हैं ताकि आर्थिक स्थिरता बनी रहे, उपभोक्ता सुरक्षित रहें, और स्वस्थ प्रतिस्पर्धा बनी रहे। नई टेक्नोलॉजी, बाजार में अस्थिरता, पर्यावरणीय मुद्दों और वैश्विक रुझानों के कारण नियमों में बदलाव होते रहते हैं। व्यापार और निवेशकों के लिए इन बदलावों पर नजर रखना जरूरी होता है, क्योंकि एक सही नीति लाभ बढ़ा सकती है, वहीं एक नकारात्मक नियम भारी नुकसान पहुँचा सकता है।
कॉर्पोरेट टैक्स, आयात/निर्यात शुल्क और विशेष उद्योगों पर कर का सीधा प्रभाव उनके मुनाफे पर पड़ता है। - कॉर्पोरेट टैक्स कटौती: कम टैक्स से कंपनियों का मुनाफा बढ़ता है और निवेश बढ़ता है। - टैक्स बढ़ोतरी: अधिक टैक्स से कंपनियों के लाभ कम हो सकते हैं, जिससे उत्पादों के दाम बढ़ सकते हैं। - सब्सिडी और टैक्स छूट: सरकारें अक्सर सौर ऊर्जा और इलेक्ट्रिक वाहनों जैसे क्षेत्रों को बढ़ावा देने के लिए टैक्स लाभ देती हैं।
जलवायु परिवर्तन से निपटने के लिए सरकारें कार्बन उत्सर्जन की सीमा, प्लास्टिक प्रतिबंध और हरित ऊर्जा अनिवार्यता जैसे नियम लागू करती हैं। जो कंपनियाँ इनका पालन नहीं करतीं, उन्हें भारी जुर्माने या संचालन प्रतिबंधों का सामना करना पड़ सकता है।
- जानकारी रखें: सरकारी नियमों को ट्रैक करें। - विविधता अपनाएँ: अलग-अलग सेक्टर्स में निवेश करें। - संभावनाएँ खोजें: उन उद्योगों में निवेश करें जो नियमों से लाभान्वित होते हैं।
तकनीक लगातार विकसित हो रही है, पारंपरिक व्यवसायों को बाधित कर रही है और नए अवसरों के द्वार खोल रही है। आर्टिफिशियल इंटेलिजेंस, ऑटोमेशन, बायोटेक्नोलॉजी और ब्लॉकचेन जैसी इनोवेशन ने व्यवसायों के काम करने के तरीके, उपभोक्ताओं की जरूरतें और निवेश के रुझान पूरी तरह बदल दिए हैं।
आज की तेज़ी से बदलती दुनिया में, जो कंपनियाँ नई तकनीकों को नहीं अपनातीं, वे प्रतिस्पर्धा में पीछे रह जाती हैं। नई तकनीकें उत्पादकता बढ़ा सकती हैं, लागत घटा सकती हैं और पूरी तरह नए बाज़ार बना सकती हैं। हालाँकि, ये पारंपरिक व्यापार मॉडल को भी अप्रासंगिक बना सकती हैं, जिससे उद्योगों को नवाचार करने या समाप्त होने के बीच चयन करना पड़ता है।
AI और ऑटोमेशन से उद्योगों में क्रांति आ रही है, जहाँ स्मार्ट एल्गोरिदम दोहराए जाने वाले कार्यों को बदल रहे हैं। - वित्त में AI: रोबो-एडवाइज़र और AI-आधारित विश्लेषण निवेश निर्णयों को बेहतर बना रहे हैं। - निर्माण में ऑटोमेशन: रोबोट उत्पादन क्षमता बढ़ा रहे हैं और श्रम लागत घटा रहे हैं। - स्वास्थ्य सेवा में AI: मशीन लर्निंग मॉडल बीमारियों का तेजी और सटीक निदान कर रहे हैं।
ब्लॉकचेन डेटा सुरक्षा, भुगतान प्रणालियों और विकेंद्रीकृत वित्त में क्रांति ला रहा है। - क्रिप्टोकरेंसी: बिटकॉइन और एथेरियम जैसी डिजिटल मुद्राएँ पारंपरिक वित्तीय प्रणालियों को चुनौती दे रही हैं। - स्मार्ट कॉन्ट्रैक्ट: मध्यस्थों के बिना कानूनी अनुबंधों को स्वचालित करते हैं। - सप्लाई चेन पारदर्शिता: कंपनियाँ उत्पादों की पूरी यात्रा को सुरक्षित रूप से ट्रैक कर सकती हैं।
दुनिया स्थिरता की ओर बढ़ रही है, जिससे हरित तकनीकें लोकप्रिय हो रही हैं। - सौर और पवन ऊर्जा: स्वच्छ ऊर्जा स्रोत पारंपरिक जीवाश्म ईंधनों पर निर्भरता कम कर रहे हैं। - इलेक्ट्रिक वाहन (EVs): टेस्ला और BYD जैसी कंपनियाँ EV क्रांति का नेतृत्व कर रही हैं। - स्मार्ट ग्रिड: AI-आधारित बिजली वितरण ऊर्जा खपत को अनुकूलित कर रहा है।
- नई तकनीकों पर नजर रखें: उभरते रुझानों पर ध्यान दें। - निवेश का विविधीकरण करें: तकनीक-संचालित कंपनियों में निवेश करें और पारंपरिक क्षेत्रों में भी जोखिम कम करें। - अनुकूलनीय बनें: जो व्यवसाय तकनीक के साथ विकसित होते हैं, वे बेहतर प्रदर्शन करते हैं।
उपभोक्ता रुझान उद्योगों की सफलता या असफलता में महत्वपूर्ण भूमिका निभाते हैं। जैसे-जैसे लोगों की प्राथमिकताएँ बदलती हैं, व्यवसायों को अनुकूलित होना पड़ता है, अन्यथा वे अप्रासंगिक हो सकते हैं। चाहे वह इलेक्ट्रिक वाहनों (EVs) की बढ़ती मांग हो, टिकाऊ उत्पादों की ओर झुकाव हो, या डिजिटल सेवाओं का विस्तार हो, उपभोक्ता व्यवहार सीधे क्षेत्रीय मांग को प्रभावित करता है।
उपभोक्ता किसी भी उद्योग की रीढ़ होते हैं। उनकी खरीदारी की आदतें, जीवनशैली और मूल्यों से बाज़ार के रुझान तय होते हैं। जो कंपनियाँ इन बदलावों की भविष्यवाणी करके अनुकूल होती हैं, वे प्रतिस्पर्धा में आगे रहती हैं, जबकि जो कंपनियाँ अनुकूल नहीं हो पातीं, वे संघर्ष करती हैं।
पर्यावरणीय जागरूकता बढ़ने के कारण उपभोक्ता पारंपरिक पेट्रोल और डीजल वाहनों से दूर जा रहे हैं। - EV लोकप्रियता: टेस्ला, BYD और रिवियन जैसी कंपनियाँ इस बाजार में अग्रणी हैं। - सरकारी समर्थन: सब्सिडी और कड़े उत्सर्जन नियम EV अपनाने को प्रोत्साहित कर रहे हैं। - बैटरी नवाचार: नई बैटरी तकनीक EVs को अधिक किफायती और कुशल बना रही है।
उपभोक्ता अब स्थिरता को प्राथमिकता दे रहे हैं, जिससे पर्यावरण-अनुकूल उत्पादों की मांग बढ़ रही है। - हरित पैकेजिंग: कंपनियाँ बायोडिग्रेडेबल और पुनर्नवीनीकरण सामग्री का उपयोग कर रही हैं। - जैविक और प्लांट-बेस्ड खाद्य पदार्थ: शाकाहारी आहार की लोकप्रियता खाद्य उद्योग को बदल रही है। - नैतिक उपभोक्तावाद: लोग ऐसी कंपनियों को प्राथमिकता दे रहे हैं जो निष्पक्ष व्यापार और नैतिक स्रोतों का समर्थन करती हैं।
डिजिटल क्रांति उपभोक्ताओं की खरीदारी, कार्य और मनोरंजन की आदतों को बदल रही है। - ई-कॉमर्स बूम: अमेज़न, फ्लिपकार्ट, और अलीबाबा जैसी कंपनियाँ खुदरा उद्योग पर हावी हैं। - स्ट्रीमिंग सेवाएँ: नेटफ्लिक्स, डिज़्नी+ और यूट्यूब पारंपरिक टीवी को बदल रहे हैं। - रिमोट वर्क कल्चर: कई कंपनियाँ हाइब्रिड या पूरी तरह से रिमोट वर्क मॉडल अपना रही हैं।
- उपभोक्ता व्यवहार को समझें: जल्द से जल्द रुझान पहचानें और सही कंपनियों में निवेश करें। - निवेश को विविध करें: पारंपरिक और उभरते उपभोक्ता क्षेत्रों के बीच संतुलन बनाए रखें। - बाज़ार परिवर्तनों को अपनाएँ: जो कंपनियाँ उपभोक्ता रुझानों के साथ बदलती हैं, वे बेहतर प्रदर्शन करती हैं।
बिना सेक्टर विश्लेषण किए निवेश करना वैसा ही है जैसे बिना नक्शे के ड्राइविंग करना—शायद आप भाग्यशाली रहें, लेकिन अधिक संभावना है कि आप रास्ता भटक जाएंगे। सेक्टर विश्लेषण करके निवेशक:
इन कारकों को समझकर, निवेशक उन क्षेत्रों की पहचान कर सकते हैं जो भविष्य में विकास कर सकते हैं या गिरावट का सामना कर सकते हैं, जिससे उन्हें बेहतर निवेश निर्णय लेने में मदद मिलती है। यह विश्लेषण विविधीकरण रणनीतियों में भी महत्वपूर्ण भूमिका निभाता है, जिससे किसी एक उद्योग में निवेश से जुड़ा जोखिम कम किया जा सकता है।

Valuation methods are essential techniques used by investors to assess a stock's intrinsic value. These methods help in determining whether a stock is fairly priced, overvalued, or undervalued relative to its market price.

Discounted Cash Flow (DCF) Analysis is a fundamental valuation method used by investors and analysts to estimate the intrinsic value of a company or an investment. The core idea behind DCF is that the value of an asset is determined by the sum of its future cash flows, adjusted (or discounted) to reflect their present value.
The value of money changes over time due to inflation and the opportunity cost of capital. A rupee today is worth more than a rupee in the future because it can be invested and earn returns. DCF accounts for this by discounting future cash flows to present value using a discount rate.
The DCF model estimates the total value of an investment based on its expected future cash flows. These cash flows are then "discounted" using a discount rate (usually the Weighted Average Cost of Capital - WACC) to determine their value in today's terms.
Predict the company’s free cash flows (FCF) over a specific period, usually 5-10 years.
Determine the discount rate, often the company's Weighted Average Cost of Capital (WACC), which reflects the cost of financing the business.
Discount each year's projected cash flow back to present value using the formula:
PV = CF / (1 + r)ⁿ
where:
- PV = Present Value
- CF = Future Cash Flow
- r = Discount Rate
- n = Number of Years
Since companies continue to operate beyond the forecast period, a "terminal value" is calculated using methods like the Gordon Growth Model:
TV = (FCF × (1 + g)) / (r - g)
where:
- TV = Terminal Value
- FCF = Last predicted Free Cash Flow
- g = Growth Rate of Cash Flows
- r = Discount Rate
Sum up the present value of all future cash flows and the terminal value.
Adjust for outstanding debt and divide by the number of shares to get the estimated share price.
Suppose a company is expected to generate ₹10,000 in free cash flow next year, growing at 5% annually. If the discount rate (WACC) is 10%, the first year's discounted cash flow would be:
PV = ₹10,000 / (1.10)¹ = ₹9,090.90
This process is repeated for multiple years, then the terminal value is calculated and added to find the total valuation.
DCF analysis is widely used by investors, financial analysts, and businesses to evaluate investment opportunities. It helps in making informed decisions regarding mergers, acquisitions, capital budgeting, and stock valuation. By accurately estimating future cash flows and choosing an appropriate discount rate, DCF can serve as a powerful tool in long-term financial planning.
Comparables Analysis, also known as "Trading Comps," is a relative valuation method that evaluates a company's worth by comparing it with similar companies in the same industry. This technique assumes that companies operating in the same sector with similar financial characteristics should have comparable valuations.
Investors and analysts use comparables analysis because it provides a quick and practical way to determine whether a company is overvalued, undervalued, or fairly priced in the market. Since stock prices and valuation ratios are constantly changing, this method helps in making real-time investment decisions.
This method involves selecting a group of similar companies (peer group) and comparing valuation multiples such as:
Suppose we are analyzing a company with a P/E ratio of 15. If similar companies in the industry have an average P/E ratio of 18, this suggests that the company may be undervalued, making it a potentially attractive investment opportunity.
This method is widely used by investors, financial analysts, and investment banks for valuing companies in mergers and acquisitions (M&A), initial public offerings (IPOs), and stock market comparisons. By using comparable valuation metrics, investors can make informed decisions regarding buying or selling stocks.

The Dividend Discount Model (DDM) is a valuation method that determines the intrinsic value of a stock based on the present value of its expected future dividends. This model is widely used by income-focused investors who prioritize steady dividend payments over speculative price appreciation.
DDM is a fundamental approach to stock valuation that helps investors assess whether a dividend-paying stock is fairly priced, overvalued, or undervalued. It is particularly useful for long-term investors who focus on companies with stable dividend payouts.
The DDM works by estimating the present value of all future dividend payments that a company is expected to distribute to its shareholders. The basic formula for the model is:
P = D / (r - g)
where:
- P = Intrinsic Value of the Stock
- D = Expected Dividend per Share for the Next Year
- r = Required Rate of Return (or Discount Rate)
- g = Expected Dividend Growth Rate
Suppose a company is expected to pay a ₹5 dividend next year, and dividends are projected to grow at 4% annually. If the required return is 10%, the stock’s intrinsic value would be:
P = ₹5 / (0.10 - 0.04) = ₹83.33
The DDM is widely used by dividend investors, pension funds, and conservative investors seeking steady income. It helps in evaluating stocks of companies with strong dividend histories, such as blue-chip firms and utility companies.
By understanding these valuation approaches, investors can make informed decisions about buying, holding, or selling a stock.
मूल्यांकन विधियाँ वे महत्वपूर्ण तकनीकें हैं जिनका उपयोग निवेशक किसी स्टॉक के आंतरिक मूल्य का आकलन करने के लिए करते हैं। ये विधियाँ यह निर्धारित करने में मदद करती हैं कि कोई स्टॉक अपने बाजार मूल्य की तुलना में सही कीमत पर है, अधिक मूल्यवान है या कम मूल्यवान है।
डिस्काउंटेड कैश फ्लो (DCF) विश्लेषण एक मौलिक मूल्यांकन विधि है जिसका उपयोग निवेशक और विश्लेषक किसी कंपनी या निवेश के आंतरिक मूल्य का अनुमान लगाने के लिए करते हैं। DCF की मूल अवधारणा यह है कि किसी संपत्ति का मूल्य उसके भविष्य के नकदी प्रवाह (कैश फ्लो) के योग के आधार पर निर्धारित किया जाता है, जिसे वर्तमान मूल्य पर समायोजित (या डिस्काउंट) किया जाता है।
मुद्रास्फीति (Inflation) और पूंजी की अवसर लागत (Opportunity Cost) के कारण पैसे का मूल्य समय के साथ बदलता रहता है। आज का एक रुपया भविष्य के एक रुपये से अधिक मूल्यवान है क्योंकि इसे निवेश कर रिटर्न अर्जित किया जा सकता है। DCF इस प्रभाव को ध्यान में रखता है और भविष्य के नकदी प्रवाह को वर्तमान मूल्य में बदलने के लिए एक छूट दर (Discount Rate) का उपयोग करता है।
DCF मॉडल किसी निवेश के कुल मूल्य का अनुमान उसके अपेक्षित भविष्य के नकदी प्रवाह के आधार पर लगाता है। फिर इन नकदी प्रवाहों को "डिस्काउंट" किया जाता है, आमतौर पर भारित औसत पूंजी लागत (WACC) के साथ, ताकि उनका वर्तमान मूल्य निकाला जा सके।
कंपनी के मुक्त नकदी प्रवाह (FCF) का एक विशिष्ट अवधि (आमतौर पर 5-10 वर्ष) के लिए पूर्वानुमान लगाना।
डिस्काउंट दर निर्धारित करना, जो आमतौर पर कंपनी की भारित औसत पूंजी लागत (WACC) होती है, जो व्यवसाय के वित्तपोषण की लागत को दर्शाती है।
प्रत्येक वर्ष के अनुमानित नकदी प्रवाह को निम्नलिखित सूत्र का उपयोग करके वर्तमान मूल्य में बदला जाता है:
PV = CF / (1 + r)ⁿ
जहाँ:
- PV = वर्तमान मूल्य (Present Value)
- CF = भविष्य का नकदी प्रवाह (Future Cash Flow)
- r = डिस्काउंट दर (Discount Rate)
- n = वर्षों की संख्या (Number of Years)
क्योंकि कंपनियाँ पूर्वानुमान अवधि से आगे भी कार्य करती हैं, इसलिए "टर्मिनल वैल्यू" गॉर्डन ग्रोथ मॉडल जैसे तरीकों से गणना की जाती है:
TV = (FCF × (1 + g)) / (r - g)
जहाँ:
- TV = टर्मिनल मूल्य (Terminal Value)
- FCF = अंतिम अनुमानित मुक्त नकदी प्रवाह (Last predicted Free Cash Flow)
- g = नकदी प्रवाह की वृद्धि दर (Growth Rate of Cash Flows)
- r = डिस्काउंट दर (Discount Rate)
सभी भविष्य के नकदी प्रवाह के वर्तमान मूल्य और टर्मिनल मूल्य को जोड़कर कुल एंटरप्राइज़ वैल्यू प्राप्त की जाती है।
कंपनी के कुल मूल्य से बकाया ऋण (Outstanding Debt) को समायोजित करके और शेयरों की संख्या से विभाजित करके प्रति शेयर मूल्य निकाला जाता है।
मान लीजिए कि एक कंपनी अगले वर्ष ₹10,000 का मुक्त नकदी प्रवाह उत्पन्न करने की उम्मीद कर रही है, जो सालाना 5% की दर से बढ़ेगा। यदि डिस्काउंट दर (WACC) 10% है, तो पहले वर्ष का डिस्काउंटेड कैश फ्लो होगा:
PV = ₹10,000 / (1.10)¹ = ₹9,090.90
इसी प्रक्रिया को कई वर्षों के लिए दोहराया जाता है, फिर टर्मिनल मूल्य की गणना की जाती है और कुल मूल्यांकन प्राप्त करने के लिए उसे जोड़ा जाता है।
DCF विश्लेषण का व्यापक रूप से निवेशकों, वित्तीय विश्लेषकों और व्यवसायों द्वारा निवेश के अवसरों का मूल्यांकन करने के लिए उपयोग किया जाता है। यह विलय, अधिग्रहण, पूंजी बजट, और स्टॉक मूल्यांकन जैसे निर्णयों में सहायक होता है। भविष्य के नकदी प्रवाह का सही अनुमान लगाकर और उपयुक्त डिस्काउंट दर का चयन करके, DCF दीर्घकालिक वित्तीय नियोजन में एक शक्तिशाली उपकरण के रूप में कार्य कर सकता है।

तुलनात्मक विश्लेषण, जिसे "ट्रेडिंग कॉम्प्स" भी कहा जाता है, एक सापेक्ष मूल्यांकन विधि (Relative Valuation Method) है जो किसी कंपनी के मूल्यांकन को समान उद्योग में काम करने वाली अन्य कंपनियों से तुलना करके निर्धारित करता है। यह तकनीक मानती है कि एक ही क्षेत्र में काम करने वाली समान वित्तीय विशेषताओं वाली कंपनियों का मूल्यांकन भी तुलनात्मक होना चाहिए।
निवेशक और विश्लेषक इस विधि का उपयोग करते हैं क्योंकि यह यह देखने का एक तेज़ और प्रभावी तरीका प्रदान करता है कि कोई कंपनी अधिक मूल्यवान (Overvalued), कम मूल्यवान (Undervalued) या उचित मूल्य पर ट्रेड कर रही है या नहीं। चूंकि स्टॉक की कीमतें और मूल्यांकन अनुपात लगातार बदलते रहते हैं, यह विधि त्वरित निवेश निर्णय लेने में सहायक होती है।
इस विधि में समान कंपनियों के समूह (Peer Group) का चयन किया जाता है और निम्नलिखित मूल्यांकन गुणांक (Valuation Multiples) की तुलना की जाती है:
मान लीजिए कि किसी कंपनी का P/E अनुपात 15 है और समान उद्योग की अन्य कंपनियों का औसत P/E अनुपात 18 है। इसका मतलब यह हो सकता है कि कंपनी कम मूल्यवान है, जिससे यह एक आकर्षक निवेश अवसर हो सकता है।
यह विधि निवेशकों, वित्तीय विश्लेषकों और निवेश बैंकों द्वारा IPOs, M&A और स्टॉक मूल्यांकन के लिए व्यापक रूप से उपयोग की जाती है।

लाभांश छूट मॉडल (DDM) एक मूल्यांकन विधि है जो किसी स्टॉक के आंतरिक मूल्य (Intrinsic Value) को उसके भविष्य में मिलने वाले लाभांश (Dividends) के वर्तमान मूल्य (Present Value) के आधार पर निर्धारित करता है। यह मॉडल उन निवेशकों के लिए विशेष रूप से उपयोगी है जो नियमित आय (Dividend Income) को प्राथमिकता देते हैं।
DDM निवेशकों को यह निर्धारित करने में मदद करता है कि कोई लाभांश देने वाला स्टॉक उचित मूल्य पर उपलब्ध है, अधिक मूल्यवान (Overvalued) है, या कम मूल्यवान (Undervalued) है। यह दीर्घकालिक निवेशकों के लिए उपयोगी है, खासकर उन कंपनियों के लिए जो नियमित रूप से लाभांश वितरित करती हैं।
DDM भविष्य में मिलने वाले सभी लाभांशों के वर्तमान मूल्य का अनुमान लगाकर स्टॉक के मूल्यांकन में मदद करता है। इसका मूल सूत्र इस प्रकार है:
P = D / (r - g)
जहाँ:
- P = स्टॉक का आंतरिक मूल्य (Intrinsic Value)
- D = अगले वर्ष का अपेक्षित लाभांश (Expected Dividend per Share)
- r = आवश्यक प्रतिफल दर (Required Rate of Return या Discount Rate)
- g = अनुमानित लाभांश वृद्धि दर (Expected Dividend Growth Rate)
मान लीजिए कि एक कंपनी अगले वर्ष ₹5 लाभांश देने वाली है, और लाभांश 4% की वार्षिक दर से बढ़ेगा। यदि आवश्यक प्रतिफल दर 10% है, तो स्टॉक का आंतरिक मूल्य होगा:
P = ₹5 / (0.10 - 0.04) = ₹83.33
यह मॉडल लाभांश निवेशकों, पेंशन फंड और उन निवेशकों द्वारा उपयोग किया जाता है जो स्थिर आय (Stable Income) की तलाश में होते हैं। DDM उन कंपनियों के मूल्यांकन में मदद करता है जो लगातार उच्च लाभांश प्रदान करती हैं, जैसे कि ब्लू-चिप कंपनियाँ और यूटिलिटी फर्म्स।
इन मूल्यांकन विधियों को समझकर, निवेशक यह निर्णय ले सकते हैं कि किसी स्टॉक को खरीदना, बनाए रखना या बेचना चाहिए।

Stock screening is the process of filtering stocks based on specific financial and fundamental criteria. Investors use stock screening to identify stocks that align with their investment strategies, saving time and improving decision-making. This method helps in narrowing down a vast universe of stocks to a manageable selection that meets predefined conditions.
The stock market consists of thousands of stocks, making it difficult to analyze each one individually. Stock screening simplifies this process by using filters to focus on stocks that match certain financial metrics and investment goals. It is particularly useful for:
Investors and analysts use various financial metrics and ratios to screen stocks effectively. Some of the most common criteria include:

Market Capitalization (or "Market Cap") is a key metric used in stock market analysis to determine the total value of a publicly traded company's outstanding shares. It is calculated using the formula:
Market Cap = Share Price × Total Outstanding Shares
This metric categorizes companies into different segments based on their total valuation, helping investors assess risk, growth potential, and investment suitability.
Market capitalization is a fundamental factor in stock selection because it helps investors understand a company's relative size, stability, and investment potential. Key benefits include:
Unlike Price-to-Earnings (P/E) ratio or Price-to-Book (P/B) ratio, which assess financial health and profitability, market capitalization gives a broader view of a company's total value in the stock market.
Investors use market capitalization to decide investment strategies. Large-cap stocks suit conservative investors looking for stability, while aggressive investors may focus on mid-cap or small-cap stocks for higher returns.
Stock screeners are online tools that allow investors to apply various filters to search for stocks that meet their investment criteria. Here’s how to use them effectively:
Stock screening is widely used by both retail and institutional investors to refine their stock-picking process. Whether you are a long-term investor looking for stable dividend stocks or a trader searching for momentum stocks, a well-structured stock screener can help you discover high-potential investments efficiently.
स्टॉक स्क्रीनिंग वह प्रक्रिया है जिसमें निवेशक विभिन्न वित्तीय और मौलिक मानदंडों के आधार पर स्टॉक्स को फ़िल्टर करते हैं। यह तकनीक निवेशकों को उनके निवेश लक्ष्यों के अनुसार सही स्टॉक्स चुनने में मदद करती है, जिससे समय की बचत होती है और बेहतर निर्णय लिए जा सकते हैं।
शेयर बाजार में हजारों कंपनियाँ सूचीबद्ध होती हैं, जिससे प्रत्येक स्टॉक का विश्लेषण करना कठिन हो जाता है। स्टॉक स्क्रीनिंग इस प्रक्रिया को आसान बना देती है और निम्नलिखित लाभ प्रदान करती है:
निवेशक और विश्लेषक निम्नलिखित महत्वपूर्ण वित्तीय संकेतकों का उपयोग करके स्टॉक्स को फ़िल्टर करते हैं:

मार्केट कैपिटलाइज़ेशन (या "मार्केट कैप") स्टॉक मार्केट में एक महत्वपूर्ण मीट्रिक है, जो किसी सार्वजनिक रूप से सूचीबद्ध कंपनी के कुल मूल्य को दर्शाता है। इसे निम्नलिखित फॉर्मूला द्वारा गणना किया जाता है:
मार्केट कैप = शेयर मूल्य × कुल बकाया शेयर
इस मीट्रिक का उपयोग कंपनियों को उनके कुल मूल्य के आधार पर विभिन्न श्रेणियों में विभाजित करने के लिए किया जाता है। यह निवेशकों को जोखिम, विकास क्षमता और निवेश उपयुक्तता को समझने में मदद करता है।
मार्केट कैप किसी कंपनी के आकार, स्थिरता और निवेश क्षमता को समझने में मदद करता है। इसके प्रमुख लाभों में शामिल हैं:
जहाँ P/E अनुपात या P/B अनुपात वित्तीय स्वास्थ्य और लाभप्रदता का मूल्यांकन करते हैं, वहीं मार्केट कैप स्टॉक मार्केट में किसी कंपनी के कुल मूल्य का व्यापक दृष्टिकोण प्रदान करता है।
निवेशक मार्केट कैप का उपयोग निवेश रणनीति तय करने के लिए करते हैं। स्थिरता चाहने वाले निवेशकों के लिए लार्ज-कैप स्टॉक्स बेहतर होते हैं, जबकि अधिक रिटर्न की तलाश करने वाले निवेशक मिड-कैप या स्मॉल-कैप स्टॉक्स को प्राथमिकता देते हैं।
स्टॉक स्क्रीनर्स ऑनलाइन टूल होते हैं जो निवेशकों को विभिन्न फ़िल्टर लागू करने और उपयुक्त स्टॉक्स खोजने में मदद करते हैं। इनका प्रभावी उपयोग इस प्रकार किया जा सकता है:
स्टॉक स्क्रीनिंग का उपयोग खुदरा और संस्थागत निवेशकों द्वारा किया जाता है ताकि वे अपने निवेश निर्णयों को बेहतर बना सकें। चाहे आप स्थिर लाभांश देने वाली कंपनियों की तलाश में हों या तेजी से बढ़ने वाले स्टॉक्स की, एक प्रभावी स्टॉक स्क्रीनर आपको उपयुक्त निवेश खोजने में मदद कर सकता है।