Multi-Leg Option Strategies — Horizontal Spreads (Calendar Spreads)
An in-depth guide to horizontal spreads (calendar spreads), explaining structure, payoff logic, risk/reward, and real-world uses for traders.
Horizontal spreads, more commonly known as calendar spreads or time spreads, represent a sophisticated class of multi-leg options strategies that shift the focus from directional price movement to the dimensions of time and volatility. Unlike vertical spreads, which profit from the underlying's price moving beyond a specific strike, calendar spreads are designed to capitalize on the differential rate of time decay between options with different expirations and on changes in the term structure of implied volatility. These strategies are particularly powerful in markets where the underlying asset is expected to exhibit low volatility and remain near a specific strike price until the near-term expiration.
1. The Philosophy of Time: What Are Horizontal Spreads?
A horizontal spread is constructed by simultaneously buying and selling options of the same type (calls or puts) and the same strike price, but with different expiration dates. The core premise is that time decay (Theta) is not linear; it accelerates exponentially as an option approaches its expiration. This strategy aims to harness this phenomenon by selling short-dated options, which decay rapidly, and buying longer-dated options, which decay more slowly, thus profiting from the decay rate differential.
- Long Calendar Spread (Debit Spread): This is the standard and most widely used calendar spread. It involves buying a longer-term option and selling a shorter-term option at the same strike. The trader pays a net debit to enter the position, which represents the maximum possible loss.
- Short Calendar Spread (Credit Spread): This is the inverse, higher-risk strategy. It involves selling a longer-term option and buying a shorter-term option at the same strike. The trader receives a net credit upfront but faces undefined, potentially significant risk from changes in implied volatility (Vega risk). This strategy is rare and typically employed only by advanced traders with a specific view on volatility compression.
2. The Core Intuition: How Calendar Spreads Profit
The profitability of a calendar spread is driven by two primary factors:
- Differential Time Decay (Theta): The sold near-term option loses time value much faster than the purchased longer-term option. As the short-dated option approaches expiration, its value evaporates rapidly if it remains near the money, while the long-dated option retains a significant portion of its time value. This divergence in value creates profit.
- Implied Volatility (Vega) Changes: A long calendar spread is positively exposed to changes in implied volatility (long Vega). If the implied volatility of the longer-dated option increases relative to the shorter-dated option, the value of the spread will increase, even if the underlying price doesn't move. This makes calendars a play on the volatility term structure steepening.
The ideal scenario is for the underlying price to be exactly at the strike price at the expiration of the short option. At this point, the short option expires worthless, and the trader is left holding the long option, which still has significant time value, for a net profit.
3. Structural Mechanics and Payoff Formulas
Defining the variables:
VL = Value of the Long-term option (bought)
VS = Value of the Short-term option (sold)
ND = Net Debit Paid (for long calendar) or NC = Net Credit Received (for short calendar)
- Long Calendar Spread P&L (at short expiry):
P&L = (VL - VS) - ND
This values the spread immediately after the short option expires. The maximum value of VL - VS typically occurs when the underlying is at the strike. - Short Calendar Spread P&L (at short expiry):
P&L = (VS - VL) + NC
This strategy profits if the short-term option's value is sustained relative to the long-term option's value, often due to a collapse in volatility.
It's crucial to understand that the payoff is not a simple function of the underlying price at a single expiry. The value must be assessed at the near-term expiration, with the long-term option's value still being a function of time and volatility.
4. Payoff Visualization and Detailed Examples
Long Calendar Spread: The Defined-Risk Time Trade
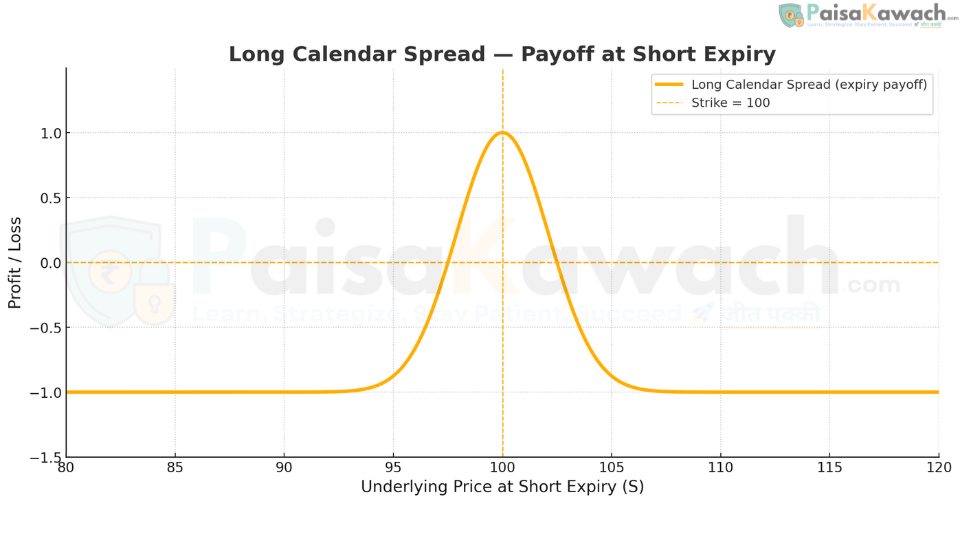
The long calendar spread is a "winning by not losing" strategy. Its payoff diagram is characterized by a pronounced peak at the strike price, illustrating that maximum profit is achieved if the underlying is precisely at the strike when the short option expires. The wings of the graph show the position losing value, but the loss is capped at the initial net debit paid.
Worked Example: NIFTY Long Call Calendar Spread
- Underlying: NIFTY 50 Index, Current Price = ₹22,000
- Strike (K): ₹22,000 (At-The-Money)
- Action: Sell 1x NIFTY 22,000 Call (Weekly Expiry) @ ₹150 | Buy 1x NIFTY 22,000 Call (Monthly Expiry) @ ₹400
- Net Debit (Max Loss): ₹400 - ₹150 = ₹250 per share.
Scenario Analysis at Weekly Expiration (Short Option Expiry):
1. NIFTY at ₹22,000 (Ideal Scenario):
- Short call expires worthless (₹0 value).
- Long call, with 3 weeks remaining, might be worth ~₹300 (mostly time value).
- Spread Value: ₹300 - ₹0 = ₹300.
- Net P&L: ₹300 (Value) - ₹250 (Debit) = +₹50 Profit per share.
2. NIFTY at ₹21,500 (Down Move):
- Both calls are Out-of-The-Money. Short call expires worthless.
- Long call, now OTM with 3 weeks left, might be worth ~₹100.
- Spread Value: ₹100 - ₹0 = ₹100.
- Net P&L: ₹100 - ₹250 = -₹150 Loss per share.
3. NIFTY at ₹22,500 (Up Move):
- Both calls are In-The-Money. Short call expires with ₹500 intrinsic value, obligating the seller.
- Long call has ₹500 intrinsic value + ~₹100 time value = ~₹600.
- Spread Value: ₹600 - ₹500 = ₹100.
- Net P&L: ₹100 - ₹250 = -₹150 Loss per share.
Strategic Interpretation & Notes
- Maximum Profit: Not a fixed number. It is theoretically the remaining time value of the long option at the short expiry if the underlying is at the strike. In practice, it is the peak of the payoff curve.
- Maximum Loss: Capped at the net debit paid (₹250). This occurs if the underlying moves far enough away from the strike that both options are either deep ITM or deep OTM, causing their values to converge (e.g., both become purely intrinsic or both worthless).
- Breakevens: There are two breakeven points. The underlying price must be within a range around the strike at expiration for the trade to be profitable. This range is where the value of the spread exceeds the initial debit.
- Ideal Conditions: Low realized volatility, stable underlying price, and an expectation that implied volatility will increase or remain stable for the longer-dated option.
Short Calendar Spread: The High-Risk Volatility Bet
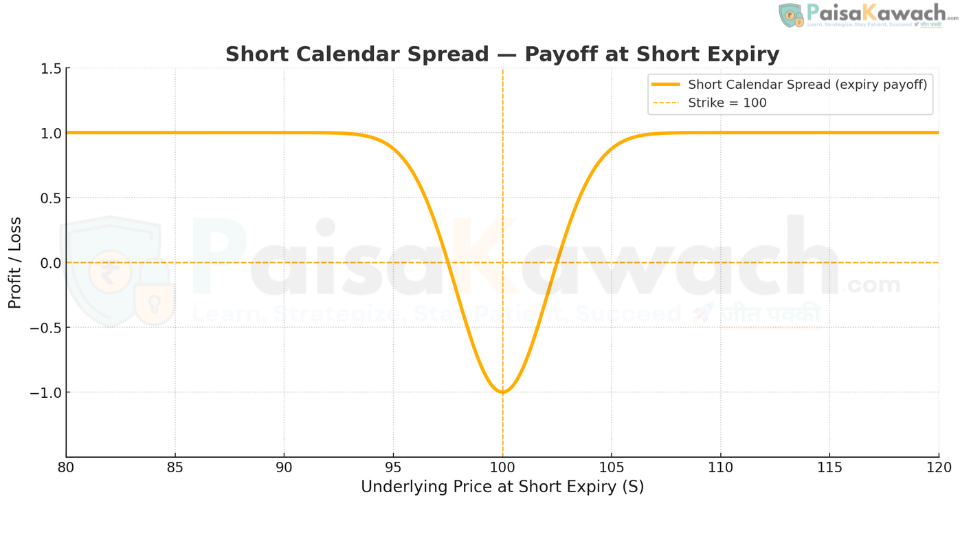
The short calendar spread is a credit strategy that profits from the collapse of time value in the near term and/or a overall decrease in implied volatility. It is a highly advanced and risky position because it is short vega—if volatility increases, the losses can be substantial as the value of the long-dated short option increases rapidly.
Worked Example: Equity Short Put Calendar Spread
- Underlying: RELIANCE, Current Price = ₹2,800
- Strike (K): ₹2,800 (At-The-Money)
- Action: Buy 1x RELIANCE ₹2,800 Put (Weekly Expiry) @ ₹80 | Sell 1x RELIANCE ₹2,800 Put (Monthly Expiry) @ ₹200
- Net Credit Received: ₹200 - ₹80 = ₹120 per share (Maximum Initial Gain).
Scenario Analysis at Weekly Expiration:
1. RELIANCE at ₹2,800 (Worst Case):
- Short-dated put bought expires worthless.
- Long-dated put sold, with 3 weeks remaining, might be worth ~₹150.
- Spread Value: ₹0 - ₹150 = -₹150.
- Net P&L: -₹150 (Value) + ₹120 (Credit) = -₹30 Loss per share.
2. RELIANCE at ₹2,600 (Large Down Move):
- Short-dated put expires with ₹200 intrinsic value.
- Long-dated put sold has ₹200 intrinsic + ~₹50 time value = ~₹250.
- Spread Value: ₹200 - ₹250 = -₹50.
- Net P&L: -₹50 + ₹120 = +₹70 Profit per share.
3. RELIANCE at ₹3,000 (Large Up Move):
- Both puts are Out-of-The-Money and expire worthless.
- Spread Value: ₹0.
- Net P&L: ₹0 + ₹120 = +₹120 Profit per share (Keep full credit).
Strategic Interpretation & Warnings
- Risk: The maximum loss is theoretically very large and undefined, especially if implied volatility spikes. The loss occurs if the underlying is near the strike at the near-term expiry, causing the short long-dated option to retain high value while the protective short-term option expires worthless.
- Usage: This is primarily a trade for sophisticated market makers or volatility arbitrageurs with a strong view that near-term volatility is overpriced relative to longer-term volatility. It is generally not recommended for retail traders due to its complex risk profile.
5. Practical Applications and Market Context
- Trading Range-Bound Markets: The premier use case. Deploy long calendars when a stock or index is trapped in a well-defined support/resistance range and is expected to stay there until the near-term expiry.
- Earnings and Event Plays: Sell short-dated options with inflated implied volatility ahead of an earnings report and buy longer-dated options as a hedge. If the stock doesn't move as much as implied, the short option's value collapses, and the spread profits.
- Volatility Term Structure Trades: Go long a calendar spread if you believe the volatility term structure will steepen (long-dated vol will rise relative to short-dated vol).
6. Key Risks and Management Techniques
- Directional Risk: A sharp, sustained move away from the strike price can cause losses. Manage by choosing strikes where strong support/resistance exists or by adjusting the position (e.g., rolling the short leg).
- Volatility Risk (Vega): For long calendars, a fall in implied volatility can hurt the position. For short calendars, a rise in IV is catastrophic. Always understand your net vega exposure.
- Assignment Risk: The short option in a call calendar can be assigned if it goes in-the-money, potentially forcing the sale of stock. This can usually be managed by closing the spread early if the short option goes deep ITM.
- Complex Exit: Calendar spreads require active management. The ideal exit is often before the short option expires to capture the decay differential without taking on assignment risk.
7. Summary: Mastering the Dimension of Time
Horizontal calendar spreads introduce the critical third dimension to options trading: time. They allow traders to profit not from where the underlying price goes, but from how slowly it gets there and how the market's expectations of future volatility evolve. The long calendar spread is a foundational, defined-risk strategy for navigating low-volatility, range-bound markets and for expressing a view on rising term structure volatility. In contrast, the short calendar is a specialized, high-risk tool for volatility experts. Mastery of these strategies equips a trader to generate consistent returns in stagnant market conditions where directional strategies fail, completing a well-rounded options arsenal.