By PaisaKawach Team | January 27, 2026
Technical indicators are among the most widely used tools in retail trading. From RSI and MACD to moving averages and oscillators, traders rely on them to make sense of price action.
However, a large percentage of market time is spent in sideways or range-bound conditions — and this is exactly where most indicators fail the hardest.
Understanding why this happens is essential if you want to reduce false signals, overtrading, and unnecessary losses.
A sideways market is a condition where price moves within a defined range, without establishing a clear upward or downward trend.
In these phases, price oscillates between support and resistance zones, often driven by balance between buyers and sellers rather than dominance from either side.
Most popular indicators are mathematical derivatives of price and time. They work best when price moves with continuity and direction.
Indicators such as moving averages, MACD, and trend-following oscillators assume that once momentum builds, it will continue.
In sideways markets, this assumption breaks down.
Indicators do not predict price — they react to it. In a range-bound environment, price changes direction frequently, causing indicators to constantly lag behind reality.
By the time an indicator confirms a move in a sideways market, price is often already near the opposite end of the range.
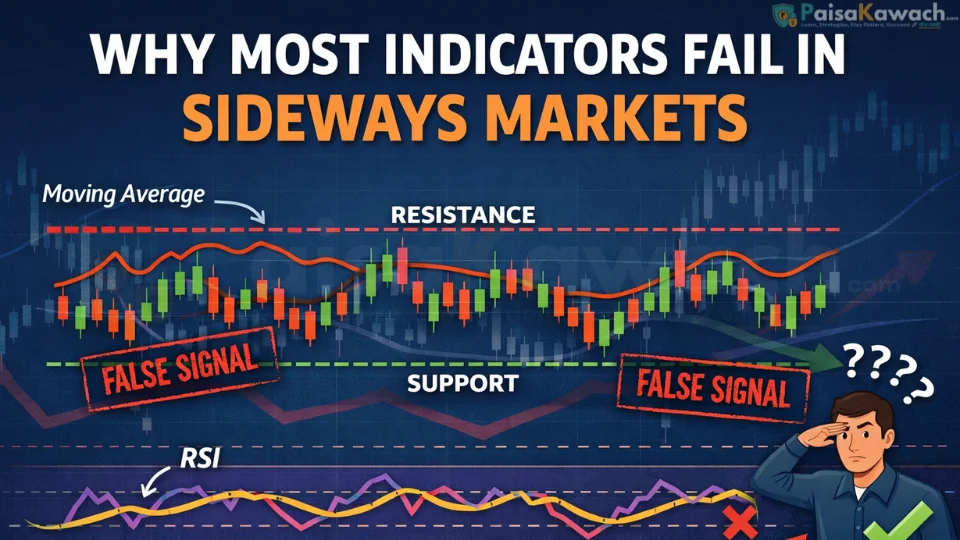
Moving averages flatten during sideways markets. Price repeatedly crosses above and below them, generating frequent buy and sell signals with no follow-through.
This results in whipsaws — small losses that accumulate over time.
Oscillators often remain overbought or oversold for extended periods without meaningful reversals.
Traders expect reversals that never materialize, or they enter too early and get trapped.
MACD crossovers occur frequently in low-momentum environments, but most of them lack structural backing from price.
More signals does not mean better signals. In sideways markets, it usually means more noise.
Sideways markets are governed by structure, not momentum.
Support zones, resistance zones, acceptance areas, and rejection levels matter far more than indicator readings during these phases.
Indicators cannot distinguish between balance and imbalance — they only measure recent price behavior.
Ranges are defined by areas where price is repeatedly accepted or rejected. These zones provide context that indicators cannot.
When indices move sideways, internal participation often weakens. Tracking gainers, losers, and sector rotation gives early clues about whether balance is strengthening or breaking.
Compressed volatility often precedes expansion. Understanding volatility behavior is more useful than chasing indicator signals.
Sideways markets punish activity and reward patience.
Reducing reliance on indicators helps traders avoid overtrading and emotional decision-making.
The goal in sideways markets is not prediction — it is preservation and preparation.
Indicators are not useless — but they are often misapplied. Using them without understanding market context leads to frustration, especially in sideways conditions.
Learning to read market structure, participation, and balance offers a more reliable framework than chasing signals that were never designed for these environments.
 Who Are Big Investors and Why Their Decisions Move Markets So Fast (Explained Simply)
Next →
Who Are Big Investors and Why Their Decisions Move Markets So Fast (Explained Simply)
Next →
 When the Budget Does Not Align With You: How Individuals, Investors, and Businesses Should Respond
No comments yet. Be the first to comment!